
Your maintenance planner just handed you next quarter's inspection schedule. 142 assets flagged, budget for maybe 40. The easy move? Spread inspections evenly, check the oldest stuff first, or wait until something breaks and call it "condition-based maintenance."
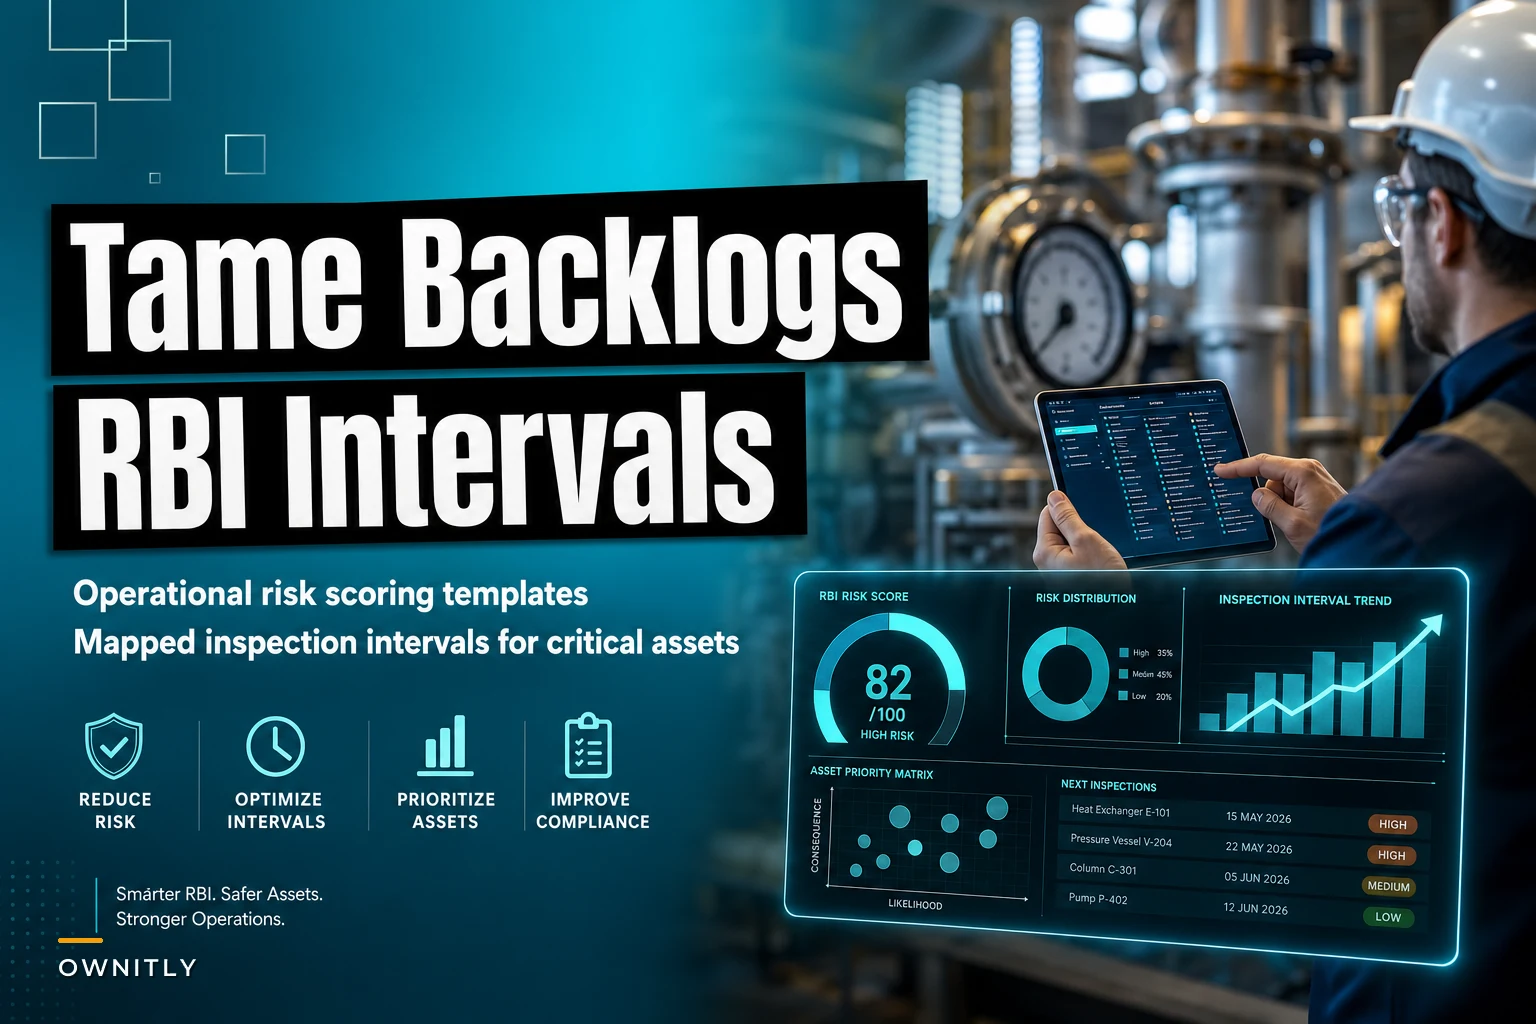
What happens when you run inspections without risk scoring is rarely subtle. A food processing plant was inspecting their backup cooling pumps every 6 months while their main ammonia compressor—supporting $400k daily production—hadn't seen a detailed inspection in three years. The compressor failed. Eleven days of lost production, then a long argument with insurance about whether proper RBI documentation would've flagged the degradation earlier.
The real problem isn't inspection frequency. Most risk based inspection programs use generic matrices that treat a $2,000 circulation pump the same as a $200,000 heat exchanger. Schedules look organized on paper but completely miss which equipment actually threatens your operation.
Why standard RBI matrices fail in mixed-asset environments
Traditional RBI uses a 5x5 matrix—probability on one axis, consequence on the other. Sounds logical until you try scoring a steam turbine against a storage tank against a conveyor system. Each asset class degrades differently, fails differently, and impacts operations differently. The matrix doesn't care.
Take pressure vessels versus rotating equipment. A vessel might show external corrosion for years before failure becomes likely—you've got time to plan, budget, and execute repairs. Rotating equipment? Vibration trends can spike from acceptable to critical in weeks. Same risk score, completely different inspection needs.
The scoring gets worse when you factor in redundancy. Three identical pumps in parallel might each score "medium risk" because individually none of them are critical. But when pump A fails, pumps B and C run harder, degrade faster, and your medium risk becomes high risk overnight. Standard matrices don't capture that.
What typically happens is teams build separate scoring systems for different equipment types. Now you're managing four risk matrices, three inspection databases, and nobody can explain why the cooling tower gets monthly inspection while the boiler goes annual. The inconsistency only shows up during incident investigations.
Building practical risk scores for real equipment types
Forget the generic 5x5 matrix. You need scoring that reflects how equipment actually behaves in your specific operation.
Stop losing track of critical assets.
Ownitly helps you monitor, maintain, and manage every asset efficiently and reliably.
- Centralized asset tracking
- Automated maintenance alerts
- Compliance monitoring & reporting
No credit card required
Production impact scoring (1-5 scale):
-
5
Immediate shutdown, no workaround possible
-
4
Shutdown within 24 hours, temporary bypass available
-
3
Reduced capacity (>50% throughput loss)
-
2
Reduced capacity (<50% throughput loss)
-
1
No production impact, maintenance convenience only
Safety/environmental scoring (1-5 scale):
-
5
Potential fatality or major environmental release
-
4
Potential lost-time injury or reportable release
-
3
Potential medical treatment or minor release
-
2
First aid only, contained release
-
1
No safety or environmental impact
Most programs stop there. You also need failure probability scoring that reflects actual equipment condition:
Rotating equipment probability factors:
-
Vibration trending (increasing/stable/decreasing)
-
Hours since overhaul versus design life
-
Lubrication analysis trends
-
Operating context (continuous/cycling/standby)
Static equipment probability factors:
-
Corrosion rate versus remaining thickness
-
Service severity (temperature/pressure/chemistry)
-
Inspection history and findings trend
-
Design margin remaining
Electrical equipment probability factors:
-
Insulation resistance trends
-
Thermal imaging deltas
-
Loading percentage versus rating
-
Environmental exposure level
For a centrifugal pump in chemical service, your score might look like:
-
Production consequence
4 (backup available but limited capacity)
-
Safety consequence
3 (chemical exposure risk)
-
Vibration trend
Increasing (probability multiplier: 1.5)
-
Hours run
80% of MTBF (probability multiplier: 1.2)
-
Final risk score
4 × 3 × 1.5 × 1.2 = 21.6
Compare that to a storage tank:
-
Production consequence
2 (multiple tanks available)
-
Environmental consequence
4 (spill potential)
-
Corrosion rate
0.003"/year, 0.180" remaining (60 years)
-
Previous inspection
Minor pitting noted
-
Final risk score
2 × 4 × 0.5 × 1.1 = 4.4
The pump needs inspection now. The tank can wait two years. That's actionable prioritization.
Converting risk scores to inspection intervals
Risk scores mean nothing without clear inspection triggers. And the interval can't be the same across all equipment types—a heat exchanger showing fouling needs different response timing than a gearbox showing wear particles.
Here's a practical interval mapping that actually works:
| Risk Score Range | Rotating Equipment | Static Equipment | Electrical | Instrumentation |
|---|---|---|---|---|
| >25 | Monthly inspection | Quarterly inspection | Monthly thermal | Weekly verification |
| 20-25 | Quarterly inspection | 6-month inspection | Quarterly thermal | Monthly verification |
| 15-20 | 6-month inspection | Annual inspection | 6-month thermal | Quarterly verification |
| 10-15 | Annual inspection | 2-year inspection | Annual thermal | 6-month verification |
| 5-10 | 2-year inspection | 4-year inspection | 2-year thermal | Annual verification |
| <5 | Run to failure | 5-year inspection | 3-year thermal | 2-year verification |
Raw intervals aren't enough though. You need adjustment factors based on what you actually find.
If vibration increases 20% between readings, cut the next interval in half. If wall thickness loss exceeds your predicted corrosion rate, accelerate from annual to 6-month checks. If thermal imaging shows no change over three consecutive inspections, extend the interval by 50%.
Document these adjustments in your inspection system. When an auditor asks why some pumps get monthly inspection and others go annual, you show them the risk scores, the trending data, and the interval logic. No hand-waving about "engineering judgment."
Below is a simple workflow visualization for converting risk scores into inspection intervals.
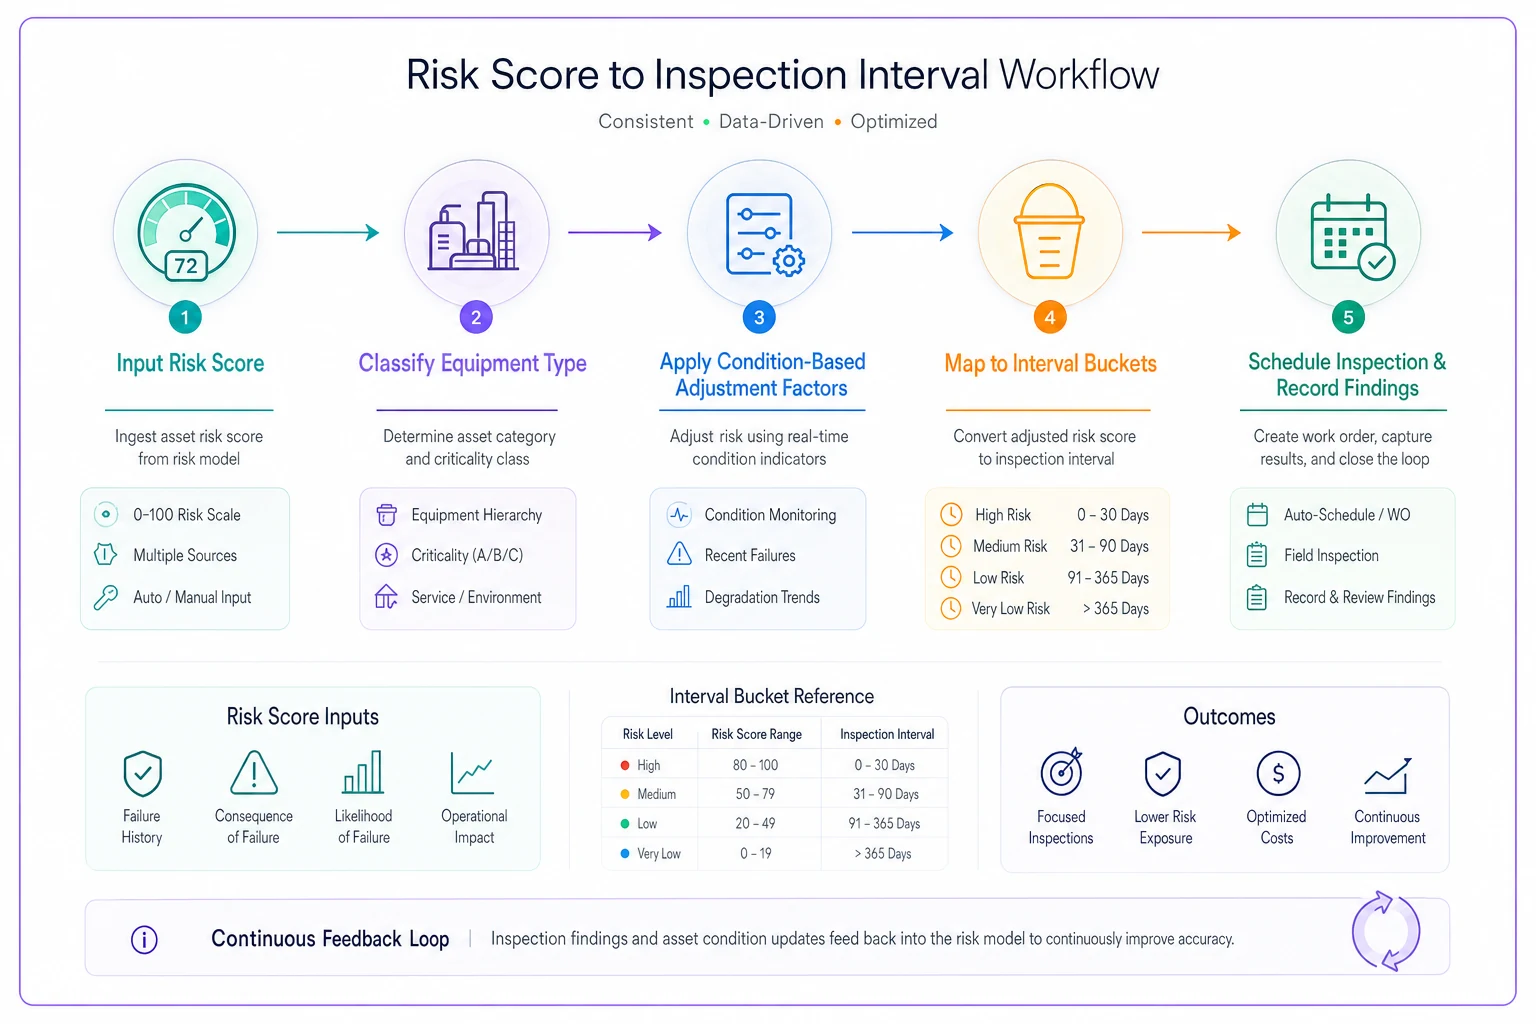
Document these adjustments in your inspection system. When an auditor asks why some pumps get monthly inspection and others go annual, you show them the risk scores, the trending data, and the interval logic. No hand-waving about "engineering judgment."
Resource allocation when you can't inspect everything
Even with solid risk scoring, you'll hit resource limits. You've identified 30 high-risk items but can only properly inspect 20 this quarter. This is where operational reality has to beat theoretical risk.
Group high-risk assets by inspection type and location. Five pumps in the same process unit? Schedule them together, share scaffold costs, use the same crew. Three heat exchangers due for eddy current testing? Bring the specialist contractor once, not three separate times.
Schedule same-process assets together to reduce mobilization costs and avoid multiple shutdowns.
Practical resource allocation tends to look something like this:
Week 1-2: Critical rotating equipment
-
Vibration routes (20-30 assets per day is realistic)
-
Oil sampling on the same route
-
Thermography during operation
Week 3: Critical vessels requiring shutdown
-
Internal inspection during planned maintenance window
-
UT thickness while unit is down
-
Gasket and valve inspection simultaneously
Week 4: Opportunistic and predictive
-
Assets near other planned work
-
Condition monitoring downloads
-
Inspection data review and trending
Plants that succeed with resource-limited RBI share one trait: they document what they couldn't inspect and why. Not inspecting something because it scored low-risk is a good decision. Not inspecting something because you ran out of time is a gap that needs fixing next quarter.
Common scoring mistakes that destroy RBI programs
The fastest way to kill your risk based inspection program is letting scores drift from reality. Three patterns come up repeatedly:
Over-scoring everything as critical. When every asset scores high-risk, you're back to inspecting everything equally—usually because people fear blame if something fails. A pharmaceutical plant scored 90% of their equipment as "critical" until they realized they were spending around $200k annually inspecting equipment that hadn't failed in 20 years.
Never updating probability scores. Your compressor has shown increasing vibration for six months but still carries its original "low probability" score from commissioning. Scores have to reflect current condition, not historical assumptions.
Ignoring operational context changes. That backup generator was low-risk when two units were running. Now one's down for rebuild and suddenly your backup is critical. But the risk score hasn't changed because "it's just the backup generator."
The fix is straightforward but requires discipline: quarterly risk review meetings. Pull your top 20 risk scores, verify they match current operations, adjust based on recent findings. Two hours every three months prevents the embarrassing failure of low-scored equipment.
Practical inspection interval adjustments
Static inspection intervals assume static conditions. But equipment faces changing conditions constantly—different products, varying temperatures, operator changes, seasonal effects. Smart RBI programs build in adjustment triggers.
Shorten intervals when:
-
Product changes increase corrosion or erosion risk
-
Temporary repairs are in place
-
Operating parameters exceed design basis
-
Sister equipment shows unexpected degradation
-
Operator concerns increase
Extend intervals when:
-
Multiple clean inspections confirm low degradation
-
Operating conditions improve (lower temperature/pressure)
-
Product changes reduce corrosion risk
-
Online monitoring shows stable trends
-
Design margins remain healthy
A chemical plant tracked these adjustments manually in spreadsheets for years. They eventually found that roughly 30% of interval changes weren't being communicated to the planning team. High-risk equipment was getting missed because the adjustment logic lived in someone's desktop folder.
This is where operational software makes a real difference. When inspection findings automatically trigger interval updates and risk scores recalculate based on current conditions, RBI actually prevents failures instead of just documenting them. Some AI-powered operational platforms can track probability factors continuously, adjusting scores as conditions change—so the inspection planner sees tomorrow's priorities today, not after something fails.
When RBI makes sense (and when it doesn't)
RBI isn't right for every operation.
RBI works well for:
-
Mixed equipment types with varying criticality
-
Budget-constrained inspection programs
-
Regulated industries requiring risk documentation
-
Aging assets with increasing failure probability
-
Complex processes with hidden critical paths
Skip RBI when:
-
You have fewer than 50 assets (just inspect everything)
-
Regulatory requirements mandate fixed intervals
-
Equipment is under warranty requiring specific inspection
-
You lack inspection history to establish trends
-
Failure consequences are uniformly catastrophic
A small water treatment plant tried implementing full RBI for their 40 assets. They spent more time scoring and documenting than actually inspecting. They switched to simple criticality ranking—critical, important, routine—and cut planning time by around 80% while maintaining reliability.
Making RBI work with limited inspection data
New plants face a chicken-and-egg problem: you need inspection history to predict failure probability, but you need probability scores to prioritize inspections. Most give up and default to manufacturer recommendations.
A better approach is conservative initial scoring with aggressive adjustment factors. Start every asset at medium-high probability until proven otherwise. After first inspection, adjust significantly—a clean inspection might drop probability 50%, minor findings might increase it 25%. Within two inspection cycles, real data replaces assumptions.
For retrofitting RBI to existing plants, mine your maintenance history. That pump that failed three times in five years? High probability, regardless of current condition. The vessel that's run twenty years without issues? Low probability until inspection proves otherwise. Work orders tell you more about real risk than engineering calculations.
Building inspection capability while managing risk
The perfect RBI program assumes infinite inspection capability—certified inspectors, advanced NDT equipment, unlimited shutdown windows. Reality is usually two techs, an ultrasonic tester they learned on the job, and a thermal camera from 2008.
Basic capability (visual + simple tools):
-
External visual inspection
-
Basic thickness measurements
-
Simple vibration meter readings
-
Infrared temperature gun checks
Intermediate capability (trained techs + standard NDT):
-
Ultrasonic thickness scanning
-
Vibration analysis and trending
-
Oil analysis interpretation
-
Thermal imaging surveys
Advanced capability (certified + specialized):
-
Phased array ultrasonic
-
Eddy current testing
-
Modal/ODS analysis
-
Acoustic emission testing
Don't pretend you have advanced capability when you don't. Better to acknowledge limits and supplement with contractors for critical equipment than to miss degradation because someone misread an ultrasonic signal.
Risk scoring for different operational contexts
Risk scores need to reflect how you actually operate, not theoretical scenarios. A backup pump in a hospital has different risk implications than the same pump in a warehouse.
24/7 operations: Higher consequence scores for any production impact. Minor failures cascade when you can't stop.
Batch operations: Lower consequence for failures between batches, extreme consequences during critical process steps.
Seasonal operations: Risk scores should shift with the season. A cooling tower is critical in summer, nearly irrelevant in winter.
Multi-product facilities: Risk changes with product. Same reactor, different chemistry, completely different failure consequences.
Document these context adjustments in your scoring logic. When someone questions why the same equipment type has different risk scores across units, you can explain the operational reality behind the numbers.
Moving from reactive to risk-based inspection
Most maintenance teams want to implement RBI but can't escape reactive mode long enough to build the program. Too busy fixing failures to prevent them.
Start with your worst actors. Those five assets causing half your emergency work? Score them first, inspect them properly, fix root causes. As reactive work drops, expand RBI to the next tier. Within six months, you'll have your critical equipment under control.
The shift happens faster with proper software support. When AI automation handles risk calculations, tracks inspection findings, and adjusts intervals automatically, your team focuses on actual inspections instead of spreadsheet management. The same crew that struggled to inspect 40 assets quarterly can handle significantly more when the administrative burden disappears.
Plants using AI-powered inspection management typically see meaningful reductions in emergency work within the first year—not because the software prevents failures, but because it ensures critical equipment gets inspected before it fails. Operational discipline created by systematic risk scoring beats heroic reactive maintenance every time.
Real risk based inspection isn't about complex matrices or probability calculations. It's about knowing which equipment actually threatens your operation and focusing limited resources where they matter most.
The scoring templates and interval rules here work because they match operational reality—rotating equipment needs different treatment than vessels, redundancy changes risk profiles, and inspection resources are always limited. Stop pretending every asset deserves equal attention. Score the real risks, inspect what matters, document what you skip and why.
Your inspection backlog exists because you're trying to inspect everything equally. Once you implement proper risk scoring and interval logic, that 142-asset quarterly list becomes 30 critical inspections and 112 documented deferrals. The critical stuff gets done properly instead of everything getting rushed.
Plants succeeding with RBI share a few traits: they update scores based on actual findings, they adjust intervals for operational context, and they use software that turns risk logic into inspection schedules automatically. They spend less time planning inspections and more time preventing failures. That's the real value of risk based inspection—not the scoring system itself, but the operational focus it creates.
Ready to elevate your asset operations?
Join 1,500+ businesses using Ownitly to optimize asset utilization, reduce downtime, and ensure compliance.