

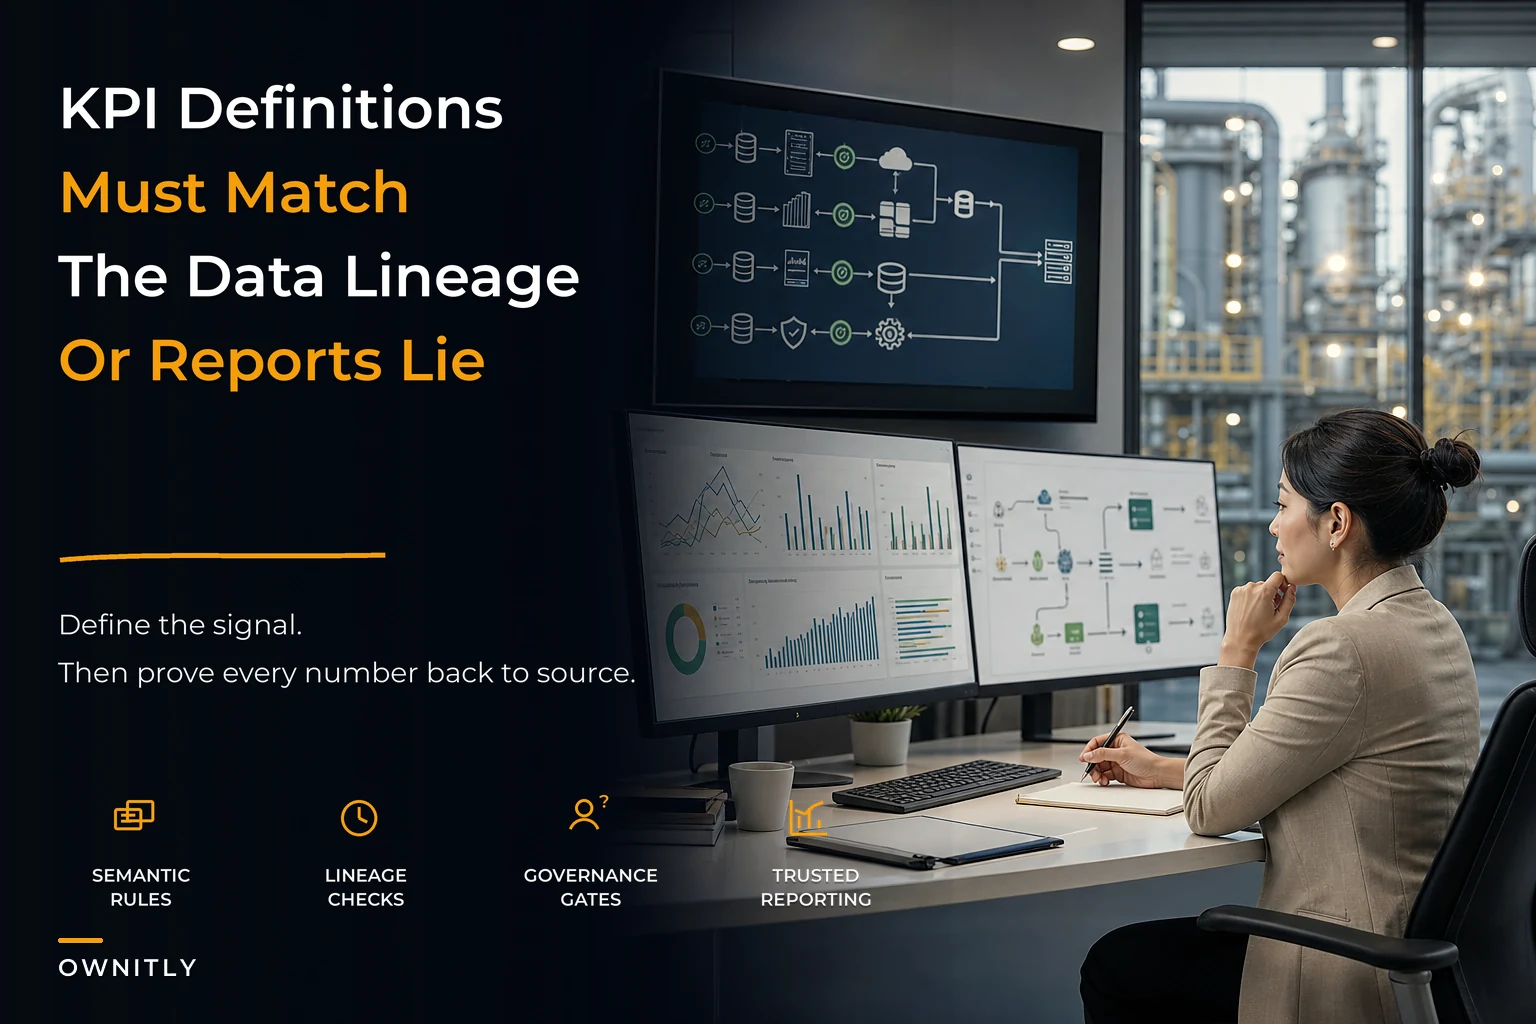

You walk into Monday's executive meeting with fresh performance dashboards showing 94% equipment availability across your fleet. The CFO nods. Two hours later, operations calls—three critical compressors have been down since Thursday, and maintenance is scrambling to source parts from Germany. Your dashboard still shows green.
This disconnect between reported metrics and operational reality kills more asset management programs than budget cuts ever will. After building asset performance measurement systems for facilities ranging from 50-unit equipment fleets to multi-site manufacturing operations with thousands of monitored assets, one pattern keeps showing up: most organizations measure noise, not signal.
The real problem isn't your CMMS or your sensors or even your reporting tools. It's the absence of semantic consistency, data lineage tracking, and governance gates between where data originates and where executives consume it. Your maintenance tech enters "pump offline" while the system calculates availability based on "equipment status = operational." Your vibration sensors feed one database while work orders live in another. Finance pulls depreciation schedules that don't match the asset register operations maintains.
The cascade of measurement failures
Asset performance measurement breaks down in predictable stages. First comes definition drift—where "mean time between failures" means one thing to reliability engineers, something else to maintenance planners, and becomes completely unrecognizable by the time it reaches the boardroom.
A chemical processing facility discovered their MTBF calculations included planned shutdowns as failures in some reports but excluded them in others. The variance was around 400 hours per quarter for critical reactors—the difference between justifying a $2M redundancy investment and deferring it another year. They only caught it because a new reliability manager questioned why their newest assets showed worse MTBF than equipment that was two decades old.
Then there's the aggregation problem. Raw sensor data gets averaged into hourly readings, hourly readings roll into daily summaries, daily summaries feed weekly reports, and somewhere in that chain the outliers that signal developing failures disappear into statistical smoothing. One food manufacturer watched their OEE steadily improve for six months on executive dashboards while actual production volumes dropped 15%. The aggregation logic counted micro-stops under 30 seconds differently at each reporting level.
Transformation errors compound everything. Vibration readings come in as velocity (inches per second), get converted to acceleration for trending, then back to displacement for severity assessments. Each conversion introduces rounding errors, unit confusion, and threshold misalignment. Multiply this across temperature, pressure, flow rates, and electrical parameters and suddenly your "integrated condition monitoring dashboard" shows assets simultaneously in perfect health and critical alarm state.
Why standard KPI frameworks fail operational reality
Most organizations adopt industry-standard KPIs expecting clarity. They implement OEE, MTTR, MTBF, asset utilization, and availability metrics straight from textbooks. Six months later, nobody trusts the numbers.
Stop losing track of critical assets.
Ownitly helps you monitor, maintain, and manage every asset efficiently and reliably.
- Centralized asset tracking
- Automated maintenance alerts
- Compliance monitoring & reporting
No credit card required
A pharmaceutical manufacturer running 24/7 validated processes discovered their OEE calculations treated changeovers, cleaning cycles, and quality holds completely differently depending on which shift supervisor logged the data. Night shift consistently showed 12% higher performance—not because they worked better, but because they categorized scheduled maintenance windows as "planned downtime" while day shift logged them as "availability losses."
What textbooks miss is that every KPI needs operational context that varies by asset class, criticality, and business model. Availability means something fundamentally different for:
-
Redundant pumps where one can be offline without impacting production
-
Single-point-of-failure compressors that shut down entire lines
-
Standby generators that must start within 10 seconds when called
-
Batch reactors that run 70% of the time by design
Standard frameworks assume homogeneous assets with consistent operational patterns. Real facilities run mixed fleets with seasonal variations, market-driven production schedules, and maintenance windows dictated by everything from union agreements to weather patterns.
Building semantic consistency across your measurement system
Creating a trusted asset performance measurement system starts with definitions that everyone—from technicians to executives—interprets identically. This isn't about writing better documentation. It's about embedding definitions into the data capture and calculation processes themselves.
Start with your five most critical KPIs. For each one, document:
Calculation formula with every variable explicitly defined. Not "MTBF = Operating Time / Number of Failures" but "MTBF = (Calendar Hours - Scheduled Maintenance Hours - Unscheduled Downtime Hours) / Count of Work Orders with Type = 'Corrective' and Priority ≥ 2"
Data sources including specific fields, tables, or sensor tags. If availability pulls from work order status fields, specify exactly which statuses count as "available" versus "unavailable."
Transformation rules for any calculations, conversions, or aggregations. If you average readings, specify the method (arithmetic mean, time-weighted average, median). Define how you handle null values, outliers, and data gaps.
Boundary conditions that clarify edge cases. What happens when an asset is down for operator error versus mechanical failure? How do you count cascading failures where one root cause triggers multiple work orders?
Refresh frequency and latency so consumers understand data currency. A KPI updated daily using last night's batch process shouldn't drive real-time operational decisions.
A mining operation standardized their "tons per operating hour" metric across six sites after discovering each site calculated it differently. Site A excluded scheduled maintenance from operating hours. Site B included it. Site C had a third definition that included idle time if operators were present. Standardization took about three months but immediately revealed that their supposed worst-performing site actually had the highest efficiency when measured consistently.
Data lineage: tracking truth from sensor to spreadsheet
Every data point in your executive dashboard should have a traceable path back to its origin. This isn't just documentation—it's about building systematic checks at each transformation point.
Modern asset performance measurement systems handle data from dozens of sources: real-time sensor networks, manual inspection rounds, work order systems, laboratory results, financial systems, and production databases. Each source has different update frequencies, data quality standards, and validation rules. Vibration sensors might stream data every second while oil analysis results arrive monthly. Work orders get backdated, sensor calibrations drift, and network outages create gaps.
Implement lineage tracking by creating a registry for each KPI that documents the full transformation path:
| Stage | Source System | Transformation | Quality Check | Failure Mode |
|---|---|---|---|---|
| Raw Data | PI Historian Tag TMP_2301 | None | Range 0-200°C | Flatline detection |
| Hourly Average | PI to SQL ETL Job | AVG() with outlier removal | >10% data coverage | Null if <6 samples |
| Daily Summary | SQL Stored Procedure | Time-weighted average | Compare to redundant sensor | Flag variance >5°C |
| Weekly Report | PowerBI Dataset | 7-day rolling mean | Check for gaps | Interpolate max 2 hours |
| Executive Dashboard | PowerBI Report | Benchmark vs baseline | Statistical control limits | Alert if outside 2σ |
This kind of registry forces you to think carefully about every step where something can go wrong—and in most facilities, something goes wrong at almost every step.
A power generation facility traced chronic data quality issues to misaligned timestamps between their distributed control system and historian. A 4-minute offset meant temperature readings got paired with pressure measurements from different operating conditions, making efficiency calculations worthless. They only found it through systematic lineage mapping.
Below is a simple visualization of the data lineage workflow from sensor to executive report.
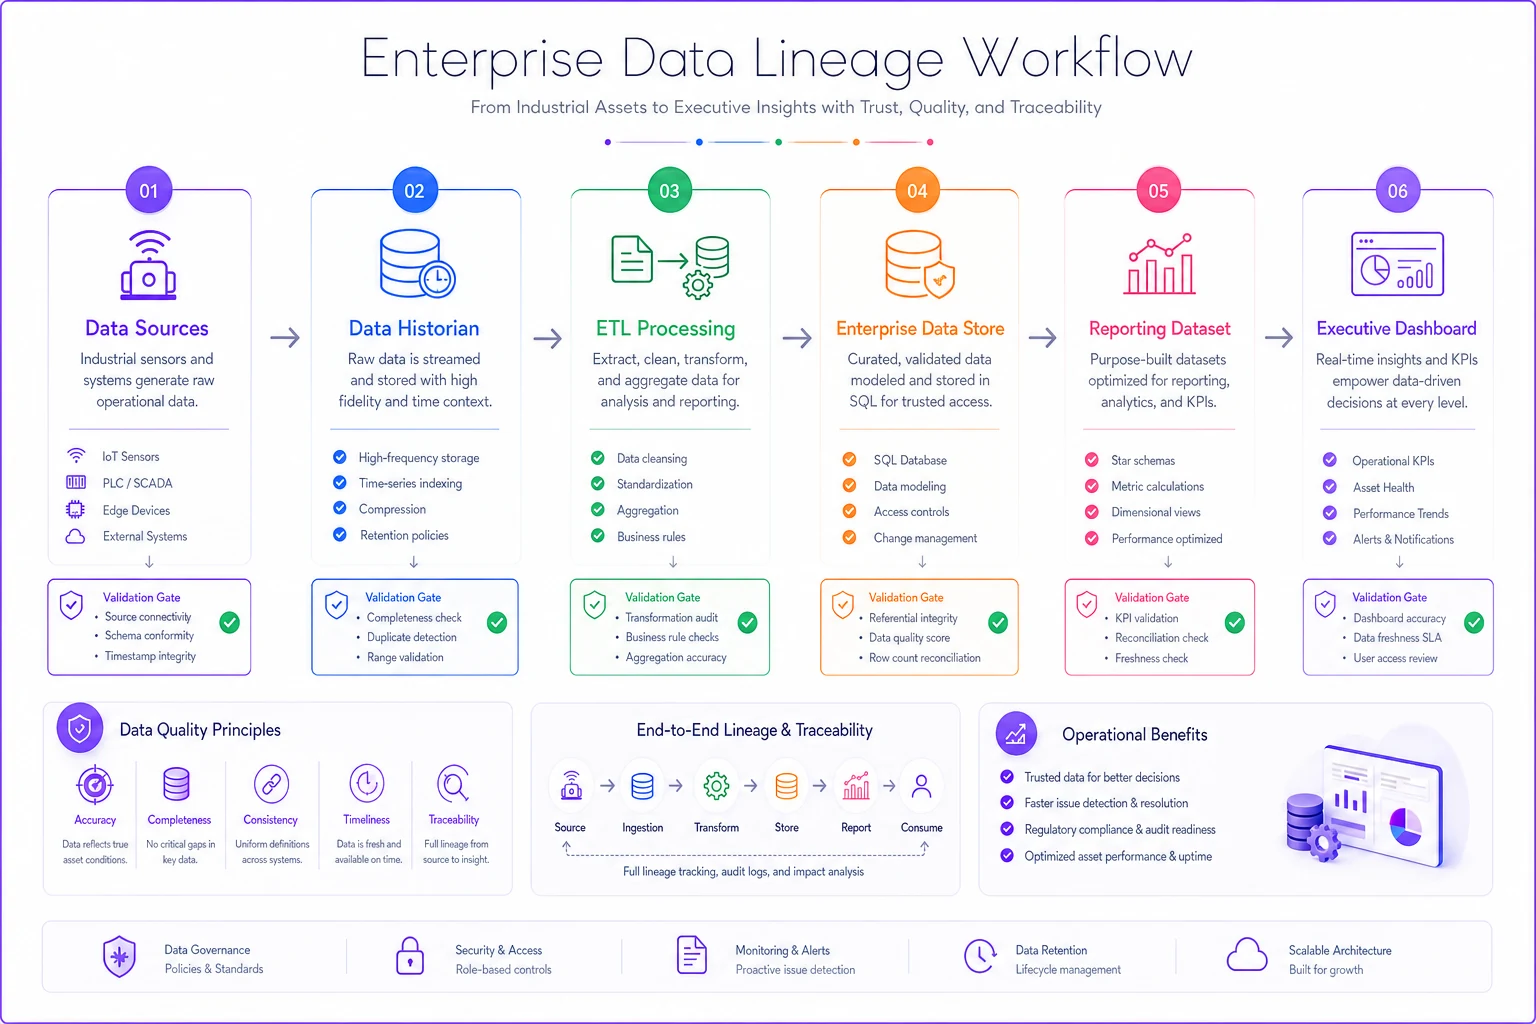
The graphic shows where to place validation checks and what to record in the KPI registry.
Lightweight governance gates that don't slow operations
Governance usually conjures images of approval committees, change control boards, and weeks of bureaucracy. Asset performance measurement needs something different—automated gates that validate data quality without requiring human sign-off at every step.
Build three levels of governance gates:
Technical gates run automatically during data ingestion and transformation. These catch obvious errors like negative runtime hours, efficiency over 100%, or temperature readings from equipment that's supposedly offline. Set these up as database constraints, ETL validations, or calculation guards that prevent bad data from propagating.
Statistical gates identify anomalies that might indicate measurement problems rather than actual equipment issues. If mean time to repair suddenly drops 50%, that's more likely a data classification change than a genuine maintenance improvement. These gates raise warnings but don't block data flow.
Business logic gates enforce operational rules that reflect how your facility actually runs. If your plant shuts down every Sunday for maintenance, any KPI showing production on Sunday needs investigation. If certain assets only run during heating season, summer availability metrics require different interpretation.
One automotive manufacturer implemented automated gates that compared calculated OEE against theoretical maximums for each production line. The gate flagged any daily OEE exceeding 85% for manual review, since their best historical performance was around 82%. This caught a reporting error where setup time got excluded from availability calculations, artificially inflating the metric by 8-12%.
The hidden cost of ungoverned metrics
Every unreliable KPI carries operational costs that compound over time. Maintenance teams lose faith in the numbers and start building shadow spreadsheets. Executives make investment decisions on faulty data. Operations and finance argue over whose numbers are "right" instead of focusing on what to do about them.
A metals processor calculated the impact of unreliable performance metrics at roughly $400K annually:
-
Around 20 hours monthly reconciling conflicting reports across departments
-
Two unnecessary equipment replacements based on false failure predictions
-
Delayed maintenance on actually degrading assets hidden by averaged data
-
One missed performance bonus because corporate didn't trust site-reported improvements
The deeper cost is organizational paralysis. When nobody trusts the asset performance measurement system, every decision requires manual validation. Improvement initiatives stall because you can't prove baseline performance. Reliability programs fail because you can't demonstrate ROI.
Good data governance becomes critical during system transitions, where poor data quality can derail entire implementations.
Practical implementation: start small, validate constantly
Building a trusted measurement system doesn't require ripping out existing infrastructure. Start with one critical asset class and five essential KPIs. Get those right before expanding scope.
Pick assets where performance directly impacts business outcomes—your constraint equipment, single points of failure, or highest maintenance spend. Define KPIs that operations, maintenance, and finance all care about. Availability and MTBF matter to everyone. Vibration velocity trends might only interest reliability engineers.
Create a validation routine that compares your KPIs against operational reality:
-
Shadow tracking
For one month, manually track your five KPIs alongside the automated system. Compare daily. Every variance needs investigation.
-
Cross-reference checks
Compare related metrics for consistency. If availability is 95% but utilization is 60%, understand why. These gaps often reveal definition problems.
-
Boundary testing
Deliberately create edge cases—assets down for partial shifts, work orders spanning month-end, sensors offline for calibration. Verify your KPIs handle these scenarios correctly.
-
Stakeholder reviews
Show the same metrics to maintenance, operations, and finance. If they interpret them differently, your definitions need work.
-
Trend validation
Compare this month's KPIs to last month's. Any dramatic shifts warrant investigation—either something changed operationally or your calculations evolved.
Run shadow tracking during a representative operational period that includes planned maintenance and peak production to catch common edge cases.
A water treatment facility validated their pump efficiency metrics by comparing calculated values against manufacturer curves. They found their flow meters consistently under-reported by 8-12%, making every pump appear inefficient. Correcting that single measurement error justified deferring $300K in planned pump replacements.
When automation amplifies measurement problems
AI-powered operational software can dramatically improve asset performance measurement—or make existing problems significantly worse. The multiplication effect works both ways.
When AI automation encounters clean, well-governed data with clear lineage, it identifies patterns humans miss. Algorithms detect subtle degradation trends, predict failures weeks in advance, and optimize maintenance schedules based on actual asset condition rather than calendar intervals. One refinery's AI system identified correlations between ambient temperature, production rates, and compressor failures that helped them avoid two summer outages.
Feed that same system ungoverned data with inconsistent definitions and broken lineage, and it amplifies every error. Pattern recognition finds false correlations. Predictive models forecast based on noise. Optimization recommendations make problems worse.
This becomes especially critical when connecting maintenance systems with other enterprise platforms, where data quality issues cascade across systems.
Build your semantic definitions, establish lineage tracking, and implement governance gates first. Then AI automation can genuinely help by:
-
Automatically detecting when data quality degrades
-
Identifying calculation anomalies that suggest definition drift
-
Monitoring for broken sensor feeds or integration failures
-
Suggesting KPI adjustments based on operational patterns
-
Flagging executive metrics that contradict operational reality
Build your semantic definitions, establish lineage tracking, and implement governance gates first. Then AI automation can genuinely help by:
Making peace with imperfect data
No asset performance measurement system achieves perfect data quality. Equipment fails, sensors drift, people make entry errors, and networks drop packets. The goal isn't perfection—it's transparency about imperfection.
Build confidence intervals into your KPIs. If you're 95% confident availability is between 91-93%, say that. Reporting 92.1% and presenting it as precise is just a different kind of problem. Acknowledge data gaps in your dashboards too. If three days of vibration data are missing, note it rather than interpolating silently.
Create separate metrics for data quality itself:
-
Percentage of assets with complete monthly data
-
Number of KPIs failing validation checks
-
Average latency between event and dashboard update
-
Count of manual data corrections required
When executives understand data limitations, they make better decisions. They learn which metrics to trust completely versus which need human judgment. They stop demanding impossible precision and start asking better questions about confidence and trends.
The path to trusted performance measurement
Building a trusted asset performance measurement system is a journey measured in quarters, not weeks. But every step toward semantic consistency, documented lineage, and automated governance pays immediate dividends.
Start tomorrow by picking one KPI that everyone questions. Document its complete calculation logic. Trace its data lineage from source to report. Implement one automated validation check. Make it bulletproof. Then move to the next metric.
Within six months you'll have a core set of trusted KPIs that drive real operational improvements. Within a year, your executive dashboards will reflect operational reality rather than statistical fiction. Your organization will stop arguing about whose numbers are right and start focusing on what those numbers actually mean for asset performance.
The technology to build world-class measurement systems exists. The challenge is the discipline to define what you're measuring, track how it's calculated, and govern the quality throughout. Get this right, and every other reliability and maintenance initiative becomes easier to justify, implement, and prove successful.
Your assets generate thousands of data points daily. The question is whether you're measuring signal or just amplifying noise. With proper KPI semantics, data lineage tracking, and lightweight governance gates, you can finally trust what your dashboards tell you—and more importantly, your executives can trust it too.
Ready to elevate your asset operations?
Join 1,500+ businesses using Ownitly to optimize asset utilization, reduce downtime, and ensure compliance.