


Most maintenance teams struggle to justify repair budgets because they can't put a dollar value on equipment downtime. You've probably been there—standing in a budget meeting trying to explain why that aging conveyor needs replacing, while finance pushes back asking for real numbers instead of gut feelings about what's critical.
The problem gets worse when you're managing hundreds of assets. Which pump failure actually costs more—the one feeding your main production line or the backup cooling system? Without a systematic way to calculate downtime costs per asset, you're basically guessing. And guessing doesn't win budget battles.
The hidden multiplication effect most teams miss
Downtime costing per asset isn't just lost production value divided by hours down. That oversimplified math misses a big chunk of the actual impact.
Take a packaging line that processes $8,000 worth of product per hour. When it goes down unexpectedly, you're not just losing that $8,000. Operators are standing around at $35/hour each. The upstream mixing equipment starts backing up, potentially spoiling $12,000 in raw materials. If the downtime stretches past 4 hours, you might trigger contract penalties with your biggest customer—another $25,000 hit.
A proper downtime costing model captures these cascading effects. Without it, you're dramatically undervaluing what failures actually cost, which means your repair priorities are probably off.
Why traditional criticality rankings fail at budget time
Most organizations use some form of criticality assessment—usually a 1-5 scale based on safety, environmental, and production impact. These rankings help with general prioritization but fall apart when you need to justify specific dollar amounts.
Stop losing track of critical assets.
Ownitly helps you monitor, maintain, and manage every asset efficiently and reliably.
- Centralized asset tracking
- Automated maintenance alerts
- Compliance monitoring & reporting
No credit card required
Your criticality matrix might correctly identify that Compressor A is "highly critical" while Pump B is "moderately critical." But if Compressor A's failure costs $3,000 per hour and Pump B costs $18,000 per hour because of its position in a bottleneck process, which repair should get funded first?
This disconnect between criticality rankings and financial impact creates a credibility gap. Finance sees your rankings as subjective opinions rather than business decisions. They need numbers they can plug into forecasts, not color-coded heat maps.
Building your downtime cost calculation framework
Here's a reproducible method that works across different asset types and industries. The key is breaking costs into measurable components your accounting team already tracks.
Direct production loss: The actual product value that won't be produced during downtime. Pull this from your ERP—it's usually tracked as standard production value per hour or per batch.
Labor inefficiency costs: What you're paying workers who can't work. Include operators, maintenance crews pulled from other tasks, supervisors managing the crisis, and administrative staff handling customer communications.
Cascading impacts: Upstream and downstream effects. Raw material spoilage, storage costs for backed-up inventory, overtime to catch up after the repair, expedited shipping to meet deadlines.
Contract and compliance penalties: Late delivery fees, SLA violations, regulatory fines for missed inspections. These often dwarf the other categories but only kick in after certain time thresholds.
Each of these buckets pulls from data your organization already collects somewhere—it's mostly a matter of connecting the right sources and applying a consistent structure. Once you've done that for a few assets, the process gets faster.
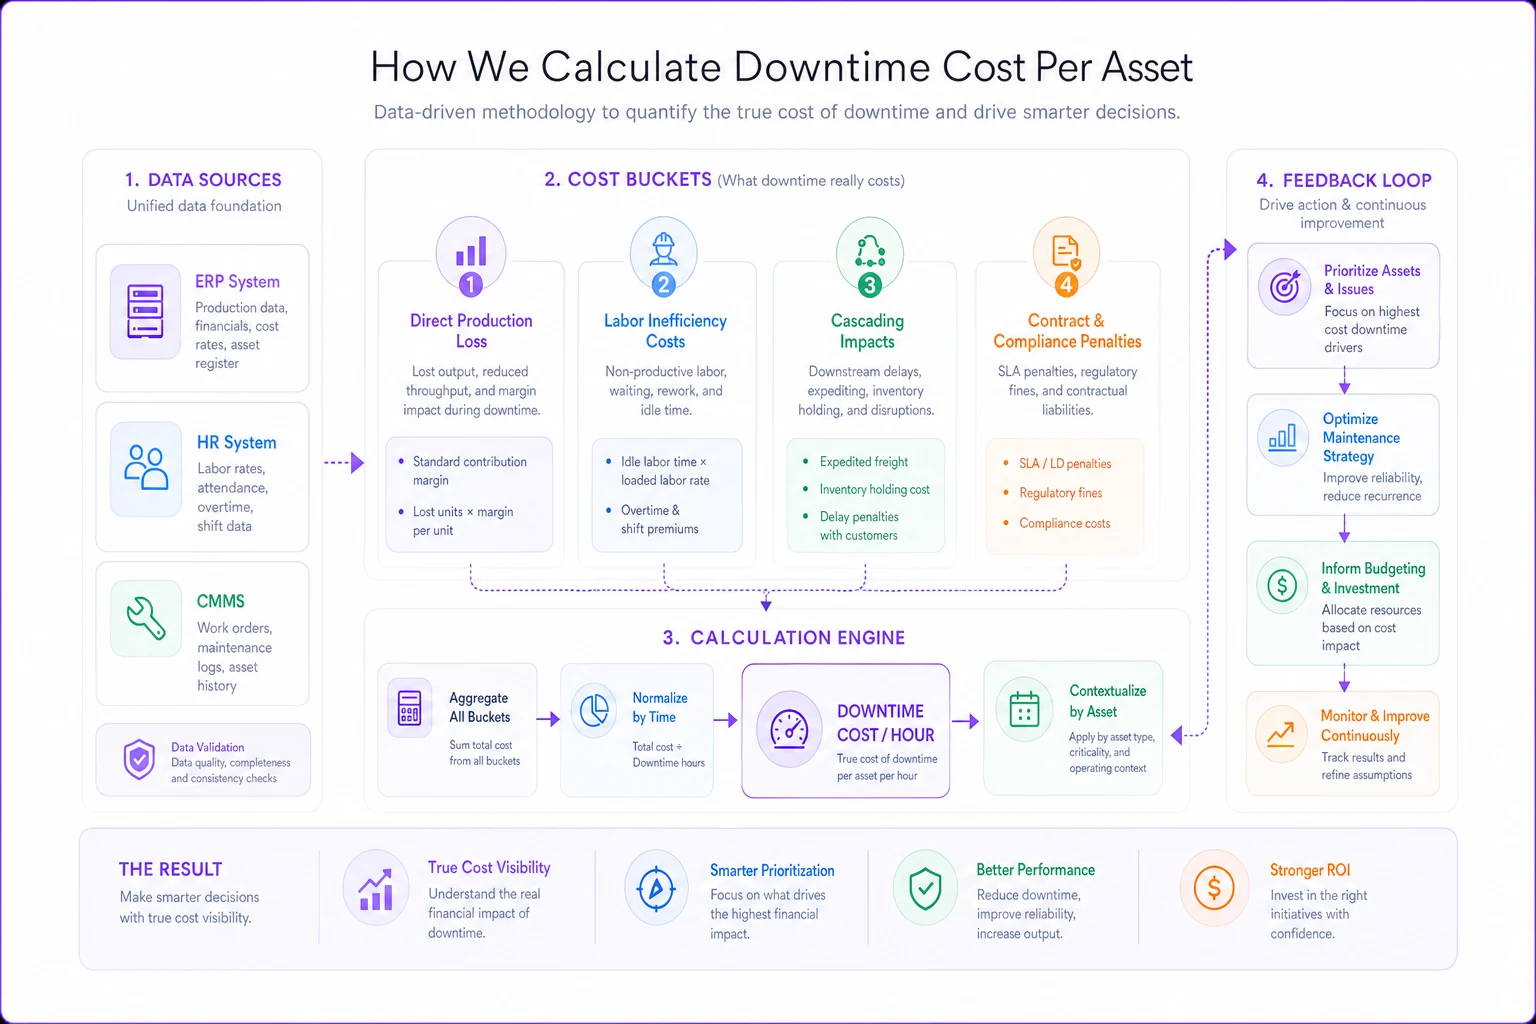
A simple workflow diagram like this helps teams align on inputs and steps.
Creating your asset-specific calculation template
Open a spreadsheet and create columns for each cost component. Here's a working template structure:
| Asset ID | Production Value/Hour | Labor Cost/Hour | Cascade Factor | Penalty Threshold | Total Cost/Hour |
|---|---|---|---|---|---|
| COMP-A1 | $8,000 | $420 | 1.3x | 4 hrs @ $25k | $11,396 |
| PUMP-B3 | $12,000 | $280 | 1.8x | 8 hrs @ $40k | $22,104 |
| CONV-C2 | $4,500 | $350 | 1.1x | None | $5,335 |
The cascade factor multiplies your base costs to account for upstream/downstream impacts. Start conservative—1.2x for standalone equipment, 1.5x for mid-process assets, and 2.0x or higher for bottleneck equipment.
For penalty thresholds, list the time trigger and penalty amount. Most contracts specify escalating penalties—$10k after 4 hours, $35k after 8 hours, $100k after 24 hours. Build these steps into your calculations.
A worked example: Hydraulic press line downtime
Basic information:
-
Produces 180 parts per hour
-
Part value
$42 each
-
3 operators at $32/hour
-
1 supervisor at $48/hour when line is down
-
Feeds directly into welding station (can't run without press)
Hour 1-3 calculations:
-
Production loss
180 × $42 = $7,560/hour
-
Labor standing idle
(3 × $32) + $48 = $144/hour
-
Cascade impact on welding
$4,200/hour in lost value
-
No penalties yet
Total: $11,904 per hour
Hour 4-8 calculations:
-
Same production and labor costs
-
Cascade expands to packaging area
additional $2,100/hour
-
Customer penalty triggers at hour 4
$15,000 one-time
Total: $14,004 per hour plus $15,000 penalty
Hour 8+ calculations:
-
Overtime kicks in for catch-up work
labor costs increase 50%
-
Second penalty tier at hour 8
additional $35,000
-
Potential material spoilage if press had parts mid-cycle
$3,000
Total: $14,220 per hour plus $50,000 cumulative penalties
By hour 8, this press failure has cost $163,760. That number makes a $45,000 preventive rebuild look like an easy call.
Converting downtime costs to repair priorities
Once you've calculated downtime costs for your key assets, you can build a priority matrix that finance will actually respect.
Expected Annual Downtime Cost = (Downtime Cost/Hour) × (Expected Failures/Year) × (Average Repair Time)
-
Calculate downtime cost per hour for each asset using the four cost buckets
-
Pull MTBF and average repair time from your CMMS or maintenance records
-
Multiply through to get expected annual downtime cost per asset
-
Rank assets by expected annual cost, not criticality score
-
Build your repair and capital project list around that ranking
Rank repairs and capital projects by their impact on reducing expected downtime costs. A well-maintained CMMS with clean asset data makes these calculations much more accurate since you're working from actual failure patterns rather than guesses.
Sort by expected cost reduction and you've got a repair priority list that speaks directly to bottom-line impact. Finance tends to respond well to this format because the logic is straightforward—reduce the highest-cost risks first.
Handling multi-impact scenarios
Some failures affect multiple production lines or create regulatory exposure beyond simple production loss. A cooling tower failure might take down three different production areas and create safety risks that shut down the entire facility.
Production Area A: $12,000/hour downtime cost
Production Area B: $8,500/hour (can partially operate)
Production Area C: $15,000/hour (complete shutdown)
Safety shutdown risk: 20% chance of triggering full facility closure at $180,000/hour
Your total expected cost becomes the sum of definite impacts plus probability-weighted potential impacts: $35,500/hour + (0.20 × $180,000) = $71,500/hour.
This approach keeps you from both overcounting (treating every possible impact as certain) and undercounting (ignoring low-probability but high-cost risks). It also gives you a defensible number when finance asks how you arrived at your estimate.
Incorporating safety and environmental factors
Not everything translates cleanly to dollars per hour, but you still need these factors in your prioritization model. The solution is creating cost proxies for non-financial impacts.
For safety incidents, use your company's internal estimates for recordable injuries, lost-time incidents, and near misses. Most safety departments track these for insurance purposes. If not, industry associations publish averages—a lost-time injury typically runs $45,000–$85,000 when you factor in medical costs, investigation time, and productivity loss.
Environmental incidents work the same way. A minor spill might cost $10,000 in cleanup and reporting. A reportable release could hit $250,000 between fines, remediation, and legal fees. A major incident affecting groundwater might exceed $2 million.
Total Asset Risk Cost = Production Downtime Cost + (Safety Incident Probability × Incident Cost) + (Environmental Risk Probability × Incident Cost)
This formula won't be perfect—nobody's safety probability estimates are precise—but it forces a structured conversation about risk rather than leaving it as a vague concern that gets deprioritized.
Building consensus with operations and finance
The biggest challenge isn't calculating these numbers—it's getting everyone to agree on the inputs and methodology. Operations tends to overestimate impacts. Finance tends to assume everything can wait another quarter.
Start by workshopping your top 10 critical assets with both teams in the room. Walk through one calculation together, line by line. Let finance challenge your cascade factors. Let operations explain why certain penalties are realistic.
Document every assumption. When operations says the conveyor failure causes $5,000 in spoilage, note where that number comes from. When finance questions your labor costs, show them the actual rates from payroll.
This transparency builds trust in your methodology. Once both sides agree on the framework, they're more likely to accept the results even when those results challenge what they assumed going in. That buy-in is what turns a calculation exercise into an actual budget decision.
When to update your calculations
Downtime costs aren't static. Production values shift with market prices, labor costs increase with contracts, and equipment modifications affect failure patterns. Refresh calculations quarterly for critical assets, annually for everything else.
Major changes trigger an immediate recalculation:
-
New customer contracts with different penalty structures
-
Process modifications affecting production rates
-
Equipment upgrades changing failure probabilities
-
Regulatory changes affecting compliance costs
Keep a change log showing what updated and why. This history helps explain why repair priorities shifted between budget cycles—which is a question you'll get asked eventually.
Software automation for continuous tracking
Manually updating hundreds of downtime calculations in spreadsheets gets unmanageable fast. Operational software with built-in calculation engines changes that significantly.
Modern maintenance platforms can pull production values from your ERP, labor costs from HR systems, and failure data from work order history—then automatically recalculate downtime costs as inputs change, keeping your prioritization current without manual intervention. The automation also catches the kind of errors that slip through spreadsheets, like forgetting to update a labor rate or missing a cascading impact. When all your assets follow the same calculation logic, you eliminate the inconsistencies that undermine credibility with finance.
Automate the ERP and CMMS links first — they eliminate the biggest sources of manual drift and improve calculation accuracy quickly.
It's not a magic fix—your data still needs to be accurate—but it removes a lot of the maintenance burden that causes teams to abandon the model after the first quarter.
Common pitfalls that inflate or deflate your numbers
Double-counting cascade impacts: If Line A feeds Line B which feeds Line C, don't count Line C's downtime twice—once as direct impact and again as cascade from Line B.
Using maximum production rates instead of average: Your line might be capable of 1,000 units per hour, but if it averages 750, use the lower number.
Forgetting partial production scenarios: Some equipment can limp along at reduced capacity. A failing pump might still deliver 40% flow, so don't treat it as 100% production loss.
Missing soft costs: Customer relationship damage, reputation hits, and employee morale impacts are real but hard to quantify. Note these separately rather than forcing them into your calculation.
Assuming immediate repair: Your calculation should include diagnosis time, parts procurement, and realistic delays. A "4-hour repair" often means 8 hours of downtime when you account for how things actually go.
Making the business case that wins budget approval
With properly calculated downtime costs, you can build business cases that actually get approved. Here's the structure that resonates with financial decision-makers:
Present the expected annual downtime cost under current conditions. Show your math transparently. Then present the reduced downtime cost after your proposed repair or upgrade, with clear assumptions about improved reliability.
The difference is your annual savings. Divide your project cost by annual savings to get payback period. Anything under 18 months usually gets approved. Under 12 months is close to automatic.
Include a sensitivity analysis showing how your ROI changes if key assumptions shift by 20%. This shows you've thought through the uncertainties and the investment still makes sense even if things don't go perfectly. Finance teams appreciate that kind of intellectual honesty—it signals you're not just cherry-picking inputs to justify a predetermined answer.
Moving from reactive to predictive with your data
Once you're tracking downtime costs systematically, patterns emerge that weren't visible before. You might find that seemingly minor equipment causes massive cascade impacts. Or that certain assets have downtime costs that spike dramatically after the 4-hour mark because of penalty structures.
These patterns let you optimize beyond simple repair prioritization. You might stock critical spares for equipment with high hourly costs but long parts lead times. Or negotiate different penalty thresholds with customers based on realistic repair timelines.
The data also supports predictive maintenance strategies by quantifying the value of preventing failures before they occur. When you can show that predictive monitoring would prevent $200,000 in annual downtime costs for a $50,000 investment, the decision is obvious. That's the shift from maintenance as a cost center to maintenance as a risk management function.
Your downtime costing model becomes the foundation for moving from "fix it when it breaks" to "prevent the expensive failures before they happen."
Turning your calculations into competitive advantage
Organizations that accurately track and minimize downtime costs per asset make better capital allocation decisions, negotiate smarter maintenance contracts, and avoid the crisis-driven overtime that destroys maintenance budgets.
Start with your top 20 revenue-critical assets. Build out the full calculation model, validate it with operations and finance, then use those priorities to drive your next quarter's maintenance planning.
As you expand the model, you'll build an institutional capability that most competitors don't have—the ability to make maintenance decisions based on actual business impact rather than technical opinions or whoever complained loudest. That capability shows up directly in the results: fewer emergency repairs, smarter capital deployment, avoided penalties, and a maintenance function that finance actually wants to fund.
Ready to elevate your asset operations?
Join 1,500+ businesses using Ownitly to optimize asset utilization, reduce downtime, and ensure compliance.