


Your reliability pilot just cut downtime by 22% on Line 3. The maintenance team is celebrating. Operations loves the stability. But when you present the case for expanding it across all production lines, finance drops the question you weren't fully ready for: "What's the total cost of ownership over the asset's full lifecycle?"
And suddenly your pilot success story stalls out as another unfunded initiative.
This happens because most asset managers present reliability improvements as maintenance projects, not investment decisions. They show immediate savings but miss the broader financial framework that CFOs and boards actually use when evaluating capital allocation.
The TCO calculation nobody really teaches you
Most asset lifecycle TCO models are either too simplistic (purchase price + maintenance = TCO) or so bloated they need a dedicated analyst to interpret. The practical version sits somewhere in between — and it shifts significantly depending on asset class.
-
Initial capital cost (obvious)
-
Installation and commissioning (often underestimated by 30–40%)
-
Operating costs including energy, consumables, labor
-
Preventive maintenance costs scaled by criticality
-
Corrective maintenance costs with failure probability curves
-
Downtime impact costs (this is where most models fall apart)
-
Disposal or replacement costs
-
Opportunity costs of tied-up capital
The complication is that each asset class needs different weightings. A $2M CNC machine has completely different TCO drivers than a $2M cooling tower, even at identical purchase prices.
The CNC machine might have high preventive maintenance costs from precision calibration, moderate energy consumption, extreme downtime costs if it's a production bottleneck, and strong residual value if maintained well. The cooling tower flips that — lower preventive maintenance, massive energy consumption, downtime impacts that cascade across multiple systems, and minimal residual value regardless of condition.
Generic TCO templates fail here because they treat all assets like variations of the same thing when operationally they behave completely differently.
Building class-specific TCO templates that actually work
Companies that struggle with this almost always make the same mistake: they try to force everything into one master template. What actually works is building separate TCO frameworks for each major asset class.
Stop losing track of critical assets.
Ownitly helps you monitor, maintain, and manage every asset efficiently and reliably.
- Centralized asset tracking
- Automated maintenance alerts
- Compliance monitoring & reporting
No credit card required
Production Equipment TCO Framework
Start with your baseline operational cost per hour when running normally. Say your injection molding machine produces $3,400 worth of product per hour at full capacity. That's your anchor.
-
Energy cost
$180/hour at current rates
-
Operator labor
$75/hour fully loaded
-
Material waste rate
2.3% on average
-
Quality inspection labor
$35/hour amortized
Your true operating cost runs around $290/hour, generating net value of roughly $3,110/hour when things are running smoothly.
Where most TCO models break is using average availability as the loss metric. A machine running at 85% availability isn't just losing 15% of production time. It's also forcing expedited shipping on delayed orders, creating overtime labor during catch-up runs, increasing scrap rates when operators rush, and generating quality issues from stop-start cycles.
The real cost of that 15% unavailability might be closer to $4,800 per hour when you factor in cascade effects — not the $3,110 you'd get from a simple lost-production calculation.
Facility Systems TCO Framework
HVAC, electrical distribution, compressed air — these need completely different TCO logic. They don't produce anything directly, but their failure touches everything.
Take a 500-ton chiller serving a pharmaceutical facility. The model needs to capture energy efficiency degradation curves (typically 3–5% annually without proper maintenance), regulatory compliance costs for refrigerant management, risk-weighted costs of temperature excursions, and redundancy requirements with their capital implications.
One pharma manufacturer found their 12-year-old chiller was costing $340,000 annually in excess energy compared to current equipment. But the TCO analysis also showed that running it to failure risked $8M in product loss from a single temperature excursion. That shifted the conversation from "should we replace it?" to "how fast can we?"
Mobile Equipment TCO Framework
Forklifts, trucks, mobile equipment — another approach entirely. TCO here is heavily influenced by utilization rates (a forklift used 2 hours daily has very different economics than one running two shifts), operator skill impact on maintenance costs, battery replacement cycles for electric units, and lease vs. buy implications on cash flow.
A distribution center running 47 electric forklifts found their TCO model was missing roughly $185,000 annually in battery replacement costs because batteries were being treated as maintenance items rather than capital components with their own depreciation schedule.
The CAPEX vs. OPEX decision matrix that finance actually respects
The ongoing battle between capitalizing and expensing maintenance work gets more complex when you're trying to fund reliability improvements. Finance wants clear rules. Operations wants flexibility. And everyone interprets the accounting standards a little differently.
Here's the framework that tends to hold up:
Definitely CAPEX:
-
Replaces a major component that extends asset life beyond original specification
-
Adds new capability or capacity
-
Costs exceed 20% of current asset book value
-
Creates a separately trackable asset
Definitely OPEX:
-
Returns asset to normal operating condition
-
Scheduled preventive maintenance
-
Costs under $5,000 (adjust for your materiality threshold)
-
Consumable parts replacement
The Gray Zone (where the fights happen):
-
Major overhauls that don't add capability
-
Upgrades that improve efficiency but don't extend life
-
Replacement of multiple components simultaneously
-
Modifications required by regulatory changes
The key is establishing decision rules before you need them. One chemical manufacturer created a simple matrix:
If the work costs more than $25,000 AND extends life by more than 2 years → CAPEX If the work costs more than $25,000 BUT only maintains current life → OPEX If the work costs less than $25,000 → OPEX regardless of impact
Rigid? Yes. But it eliminated roughly 80% of their CAPEX/OPEX debates. The remaining 20% went to a monthly review committee with representation from operations, maintenance, and finance.
Depreciation strategies that match operational reality
Standard straight-line depreciation makes accountants comfortable but doesn't reflect how assets actually deteriorate. A pump doesn't lose value evenly across 15 years — it might run cleanly for 8 years, need increasing attention for the next 4, then fail hard.
Smart organizations are moving toward units-of-production depreciation for critical production assets. Instead of depreciating a $400,000 extruder over 10 years at $40,000 annually, you depreciate based on actual output.
-
Depreciation per pound
$0.008
-
Year 1 production
6.2 million pounds = $49,600 depreciation
-
Year 2 production
5.8 million pounds = $46,400 depreciation
This aligns book value with actual usage and makes TCO calculations more accurate. It also creates natural triggers for replacement planning — when you're approaching rated lifecycle production, you know it's time to move.
When you switch to units-of-production, ensure your CMMS reliably captures throughput metrics so depreciation aligns with recorded usage.
Most companies miss this part: different asset categories need different depreciation strategies.
Production Equipment: Units of production or machine hours
Facility Systems: Modified straight-line with condition adjustments
Mobile Equipment: Combination of years and hours/miles
Tools and Instruments: Group depreciation for similar items
Applying the wrong depreciation method to an asset class doesn't just create accounting friction — it makes your replacement timing decisions harder to defend when you're in front of a capital committee.
Creating governance checkpoints that connect pilots to funding
The biggest mistake in reliability pilot programs is running them completely disconnected from the budgeting cycle. Your pilot might show strong results in March, but if capital planning happened in January, you're sitting on your hands for another year.
Successful organizations build checkpoints that align pilot programs with actual funding decisions.
Checkpoint 1: Pilot Definition (Month 0)
Before starting, document the current baseline performance metrics, target improvements with specific numbers, investment required for pilot and full rollout, and go/no-go criteria for expansion.
A food processor testing predictive maintenance on blast freezers documented their baseline as 6 unplanned failures annually at $180,000 average cost each. Their target was reducing to 2 failures annually. The pilot investment was $45,000 for 3 freezers, with a full rollout of $380,000 for all 24 units. Success criteria: 50% reduction in failures over 6 months.
Checkpoint 2: Quarterly Review (Month 3)
Don't wait for pilot completion to start building your case. At the quarterly mark, document early indicators, identify implementation challenges, refine cost estimates based on actual learnings, and prepare a preliminary business case.
That freezer pilot flagged 2 bearing temperature trends in the first quarter that would have become failures. Projected annual savings: $270,000 from just the 3 pilot units.
Checkpoint 3: Funding Gate (Month 5)
This is where most pilots die — the gap between proving value and locking in funding. You need final pilot results with verified data, a detailed rollout plan with phases, risk mitigation strategies, and a CFO-ready financial model.
Translate operational metrics into financial language. Don't say "we reduced vibration levels by 30%." Say "we prevented 4 failures worth $720,000 in downtime and repairs, generating 16x ROI on the pilot investment."
Checkpoint 4: Implementation Review (Month 8)
After funding approval, establish gates for the rollout covering phase 1 completion metrics, budget vs. actual tracking, benefit realization confirmation, and decision points for the next phase.
This flow summarizes the pilot-to-funding checkpoints and key deliverables at each gate.
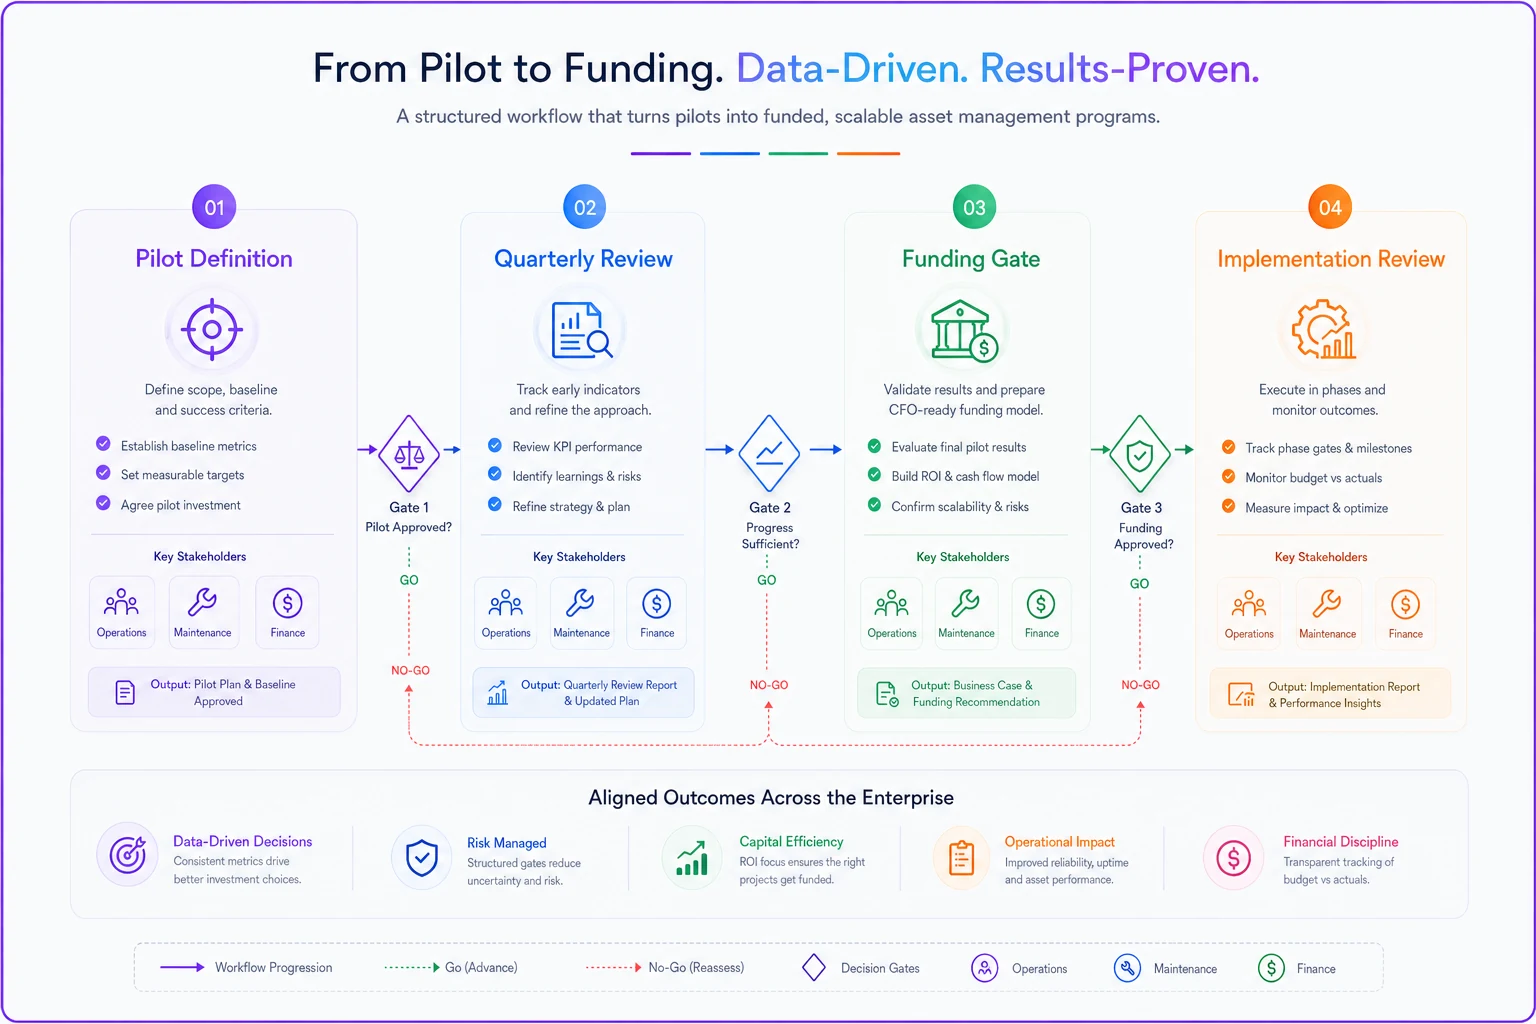
Use these checkpoints to ensure pilots don't miss the annual capital planning window and to provide finance the evidence they need at each decision point.
When reliability improvements actually deserve capital funding
Not every successful pilot deserves expansion funding. Some reliability improvements, while operationally valuable, don't clear capital allocation hurdles — and that's fine.
A reliability improvement deserves capital funding when it addresses a bottleneck asset, because improving reliability on a constraint multiplies value across the entire operation. One beverage manufacturer spent $200,000 on reliability improvements for their single bottle-capping line and generated $3.2M in additional throughput.
It also makes sense when the payback period aligns with asset remaining life. Installing $100,000 of condition monitoring on a pump with 2 years remaining life rarely pencils out unless that pump is absolutely critical.
Sometimes the investment isn't even about ROI — it's about risk exposure. A refinery spent $4M on reliability improvements that saved $400,000 annually, but the real driver was eliminating a $40M explosion risk. Numbers like that don't need much defending.
And then there's the strategic dependency angle. That CMMS migration you've been planning might depend entirely on having clean, reliable asset performance data coming out of your pilot program. Reliability investments that unlock other initiatives carry more organizational weight than they're usually given credit for.
The hidden politics of reliability funding
Reliability funding is as much about organizational dynamics as economics. You can have a bulletproof TCO model and still watch your initiative go nowhere.
Finance teams worry about precedent. Fund one program on "soft" benefits and every department wants the same treatment. They default to no unless you make the numbers concrete and verifiable. Operations leaders have seen too many reliability programs create more work than value — they want simplicity and integration with existing workflows, not another system to manage. IT gets nervous about data integration. Your condition monitoring system needs to connect with their ERP, CMMS, and reporting platforms. Ignore this early and you'll face resistance when it's much harder to fix.
The approach that works is building your coalition before you need approval:
-
Get finance involved in defining success metrics upfront
-
Have operations help design the implementation approach
-
Include IT in technology selection, not just deployment
-
Share early wins broadly to build momentum before the funding conversation
When you build that coalition and align metrics, the capital conversation becomes about verified outcomes rather than departmental anecdotes.
TCO templates by asset class
These are starting frameworks — they need real customization for your context, but they give you a working structure.
Rotating Equipment TCO Template
| Cost Category | Year 1-3 | Year 4-7 | Year 8-10 | Year 11+ |
|---|---|---|---|---|
| Energy (% of baseline) | 100% | 103-108% | 110-118% | 120-130% |
| Preventive Maintenance | $X/year | $1.2X/year | $1.5X/year | $2X/year |
| Corrective Maintenance | 0.5X/year | 1X/year | 2X/year | 4X/year |
| Downtime Risk | Low | Medium | High | Critical |
| Rebuild/Replace Decision | Monitor | Plan | Evaluate | Execute |
Production Line TCO Template
| Component | Initial Cost | Annual OPEX | Replacement Cycle | Criticality Score |
|---|---|---|---|---|
| Main Drive | $125,000 | $8,000 | 12-15 years | 10 (bottleneck) |
| Conveyor System | $45,000 | $3,500 | 8-10 years | 7 (redundant path) |
| Control System | $75,000 | $2,000 | 7-8 years | 10 (no backup) |
| Auxiliary Equipment | $30,000 | $4,000 | 5-7 years | 4 (manual backup) |
Facility Systems TCO Template
For HVAC and utility systems, focus on efficiency degradation across age bands:
-
Year 1–3
Baseline efficiency, standard maintenance costs
-
Year 4–6
5–8% efficiency loss, 20% increase in maintenance
-
Year 7–10
12–18% efficiency loss, 50% increase in maintenance
-
Year 10+
Evaluate replacement based on efficiency gap vs. current technology
The point of these templates isn't precision — it's giving decision-makers a consistent framework to compare assets and prioritize capital. Once you're working from common numbers, the conversations get much faster.
Making the shift from cost center to value creator
The real shift happens when you stop framing maintenance and reliability as costs to minimize and start positioning them as investments to optimize. This isn't semantics — it actually changes how decisions get made.
A specialty chemicals manufacturer created "Asset Investment Scorecards" for each critical asset category. Instead of tracking maintenance costs, they tracked total value generated (production output × margin), total investment including CAPEX, OPEX, and downtime, return on asset investment as a ratio, and forward-looking investment requirements with expected returns.
Within 18 months, their reliability programs went from scrapping for budget to receiving board-level strategic funding. The difference was speaking in the language of investment and return rather than cost and budget.
Where AI automation changes TCO modeling
Building and maintaining accurate TCO models across hundreds or thousands of assets is where most organizations hit a wall. The manual effort to track actual costs, update deterioration curves, and recalculate projections becomes unmanageable fast.
AI-powered operational software handles a lot of that automatically — pulling actual maintenance costs from your CMMS and ERP, tracking energy consumption from monitoring systems, calculating real downtime costs from production data, updating deterioration curves based on condition monitoring, and flagging assets where TCO is approaching replacement thresholds.
One manufacturing company reduced their TCO modeling effort from around 200 hours monthly to roughly 20, while actually improving accuracy. The automation handles data collection and calculation. People focus on interpretation and decisions.
The bigger benefit isn't efficiency though — it's having living TCO models that reflect actual operational reality instead of theoretical estimates from last quarter's spreadsheet. When your reliability pilot shows results, you can generate TCO impact projections for full rollout immediately, including sensitivity analysis across different implementation scenarios.
From pilot to portfolio
The gap between a successful reliability pilot and funded expansion isn't about proving value — it's about speaking the language of capital allocation. Your TCO models, depreciation strategies, and governance checkpoints need to match how your organization actually makes investment decisions.
Stop treating reliability improvements as maintenance activities. Build TCO models that reflect the true complexity of different asset classes. Create governance structures that connect pilot outcomes to funding cycles.
Securing reliability funding is also partly about building organizational confidence, not just presenting numbers. When finance sees rigorous TCO analysis, when operations sees a practical implementation plan, and when leadership sees risk mitigation alongside returns — that's when pilots stop being interesting experiments and start becoming funded programs.
The organizations winning at asset management aren't the ones with the best pilots. They're the ones who've built the frameworks to turn pilot results into portfolio-wide investment decisions.
Ready to elevate your asset operations?
Join 1,500+ businesses using Ownitly to optimize asset utilization, reduce downtime, and ensure compliance.