

Most maintenance teams don't have a shortage of good ideas. They have a shortage of ideas that survive contact with reality. Someone reads about ultrasonic greasing, tries it on one line, sees vibration alarms drop, and declares victory. Six months later nobody can explain why the program stalled, whether the alarm drop was real or seasonal, or why the request for funding to roll it out to twelve more lines died in a budget meeting.
That gap — between "we tried something and it seemed to work" and "we proved it worked and got it funded across the site" — is where the real value of a maintenance continuous improvement cadence lives. Not the improvement itself. The cadence that lets you run twenty experiments a year, kill the fifteen that don't pan out fast and cheap, and scale the five that do with evidence strong enough that Finance stops arguing.
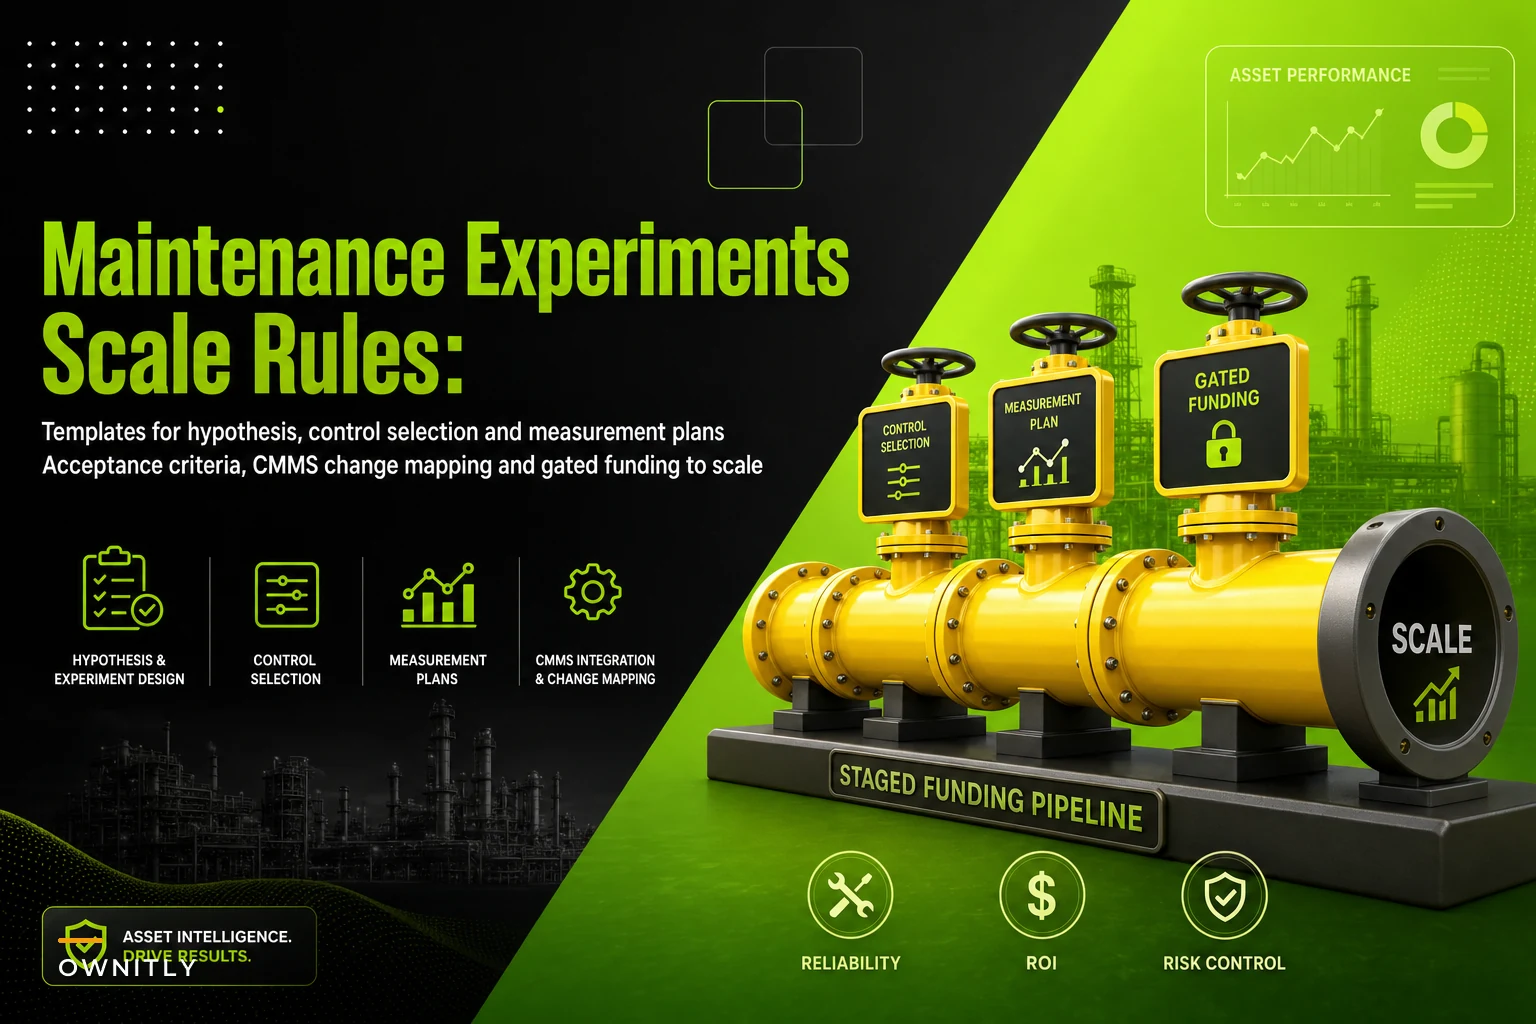
This post is about the machinery that makes that possible: a reusable experiment template, how you pick a control, how you write a measurement plan that doesn't lie to you, the acceptance criteria that decide go/no-go, how you map the winning change back into your CMMS so it actually sticks, and the funding gates that let a proven experiment turn into a budgeted rollout.
The core problem: experiments that can't be judged
The pattern shows up again and again. A reliability engineer runs a "pilot." There's no written hypothesis, so afterward everyone argues about what the pilot was even supposed to prove. There's no control, so when failures drop you can't tell if it was the intervention or just a good quarter. The measurement is whatever data happened to be lying around in the CMMS. And there's no pre-agreed threshold for success, so the results get interpreted by whoever has the strongest opinion in the room.
An experiment you can't judge is worse than no experiment. It burns real technician hours, it consumes political capital, and it produces a "result" that either gets oversold — and later blows up when it scales badly — or gets ignored because nobody trusts the number. The whole point of a cadence is to make every experiment judgeable before you run it.
So the template exists to force a handful of decisions up front, when they're cheap to make, instead of after the data comes in, when they're contaminated by what you're hoping to see.
The experiment template: seven fields that force honesty
Keep it to one page. If it takes longer than one page, people won't fill it out, and a template nobody fills out is just a document. Every experiment charter in the cadence carries these fields.
Stop losing track of critical assets.
Ownitly helps you monitor, maintain, and manage every asset efficiently and reliably.
- Centralized asset tracking
- Automated maintenance alerts
- Compliance monitoring & reporting
No credit card required
-
Hypothesis (in if/then/because form). Not "let's try ultrasonic greasing." Instead: If we switch bearings on the packaging line motors to ultrasonic-guided greasing, then grease-related bearing failures will drop by at least 40% over 6 months, because we'll stop over- and under-greasing which is the root cause in 3 of our last 5 failures. The "because" is the part people skip, and it's the most important. It states your causal theory, which is what you're actually testing.
-
Control selection. What are you comparing against? More on this below — it's the field people get wrong most often.
-
Measurement plan. The specific metrics, where the data comes from, who records it, and how often. If a human has to remember to log something, assume it won't get logged consistently.
-
Acceptance criteria. The pre-agreed numbers that decide success, partial success, or failure. Written before the experiment starts. No moving the goalposts.
-
Duration and sample size. How long, how many assets, why that's enough to see a real effect and not just noise.
-
Cost and effort. What it takes to run — labor hours, parts, sensors, downtime. This feeds the funding math later.
-
CMMS change mapping. If this works, exactly what changes in the system? Which PM, which frequency, which task list, which parts kit. If you can't name the change, you can't scale it.
The discipline here isn't complicated. It's just uncomfortable, because it forces you to commit to what "success" means while you still might fail.
Control selection: the field everyone gets wrong
You can't prove a change worked if you have nothing to compare it to. And "compared to last year" is almost always a bad control — last year differed in production volume, weather, staffing, and a dozen other things you didn't hold constant.
Better options, roughly in order of strength:
| Control type | How it works | When it's good | The catch |
|---|---|---|---|
| Parallel identical assets | Run the change on Line A, keep Line B unchanged | You have near-identical redundant assets | Rare — most sites don't have true twins |
| Matched cohort | Group similar assets by duty, age, criticality; treat half | You have a fleet of similar units (pumps, HVAC, conveyors) | Requires enough units to split meaningfully |
| Staggered rollout | Roll out in phases; earlier phases act as reference | Change is clearly beneficial and you can't ethically withhold | Timing effects contaminate the comparison |
| Before/after with covariate adjustment | Compare same assets before and after, adjusting for volume/season | You genuinely can't split the fleet | Weakest; easy to fool yourself |
In real operations, the matched cohort is the workhorse. A typical example: you've got 18 similar centrifugal pumps across two buildings. Nine get the new seal-flush procedure, nine keep the old one. Match them on run hours and service so the two groups look similar going in. If seal failures drop in the treated nine but stay flat in the untreated nine over the same period, you've got something real — because both groups lived through the same summer, the same production swings, the same short-staffed weeks.
The mistake that keeps showing up: teams treat their best-maintained assets in the experiment and compare against the fleet average. Of course the treated assets look better — they were already the healthy ones. Match on condition, not convenience.
Writing a measurement plan that doesn't fool you
Two failure modes dominate here. The first is measuring the wrong thing — tracking activity ("we did 40 ultrasonic checks") instead of outcome (bearing failures, unplanned downtime hours, MTBF). Activity metrics feel productive and prove nothing.
The second is a dirty baseline. If you're going to claim failures dropped 40%, you need a trustworthy "before" number. A lot of teams discover their historical failure data is garbage — miscoded work orders, failures logged as "general repair," reactive jobs never linked to the asset. If your baseline is noisy, fix that before you start, or your whole experiment inherits the noise.
A workable measurement plan specifies:
-
Primary metric — the one outcome that decides the experiment (e.g., grease-related bearing failures per 1,000 run-hours).
-
Guardrail metrics — things that must not get worse (e.g., total labor hours, safety incidents). A "win" that quietly triples technician workload isn't a win.
-
Data source and coding — which CMMS failure codes count, how they get entered, and a quick weekly check that they're being entered right.
-
Cadence — when you look at the data. Weekly glance for guardrails, formal review at the pre-set decision point.
One practical note: put a single named person in charge of data integrity for each experiment. Not "the team." When everyone owns the data, nobody does, and you find out at the review meeting that half the treated pumps' work orders got coded to the wrong asset.
Acceptance criteria: decide the verdict before you have feelings about it
Acceptance criteria are just the numbers that trigger a decision. The trick is writing three tiers, not one, because binary pass/fail throws away useful outcomes.
-
Scale it primary metric hits or beats target, guardrails stay green. → Move to funding gate.
-
Extend or refine direction is right but the effect is smaller than target, or one guardrail wobbled. → Run longer, or adjust the procedure and re-test. Don't scale yet.
-
Kill it no meaningful effect, or a guardrail broke. → Document why and stop. This is a success of the cadence, not a failure.
The killing part matters more than people admit. A cadence that never kills anything isn't disciplined — it's just optimism with paperwork. If you're not stopping the majority of your experiments, your acceptance criteria are too loose, and you're scaling things that don't deserve it.
Write these thresholds into the charter, get sign-off from whoever controls the budget, and treat them as binding. The entire value of pre-committing is that you can't rationalize a mediocre result into a "win" after the fact.
Mapping the winning change into the CMMS so it doesn't evaporate
This is where more good experiments die than anywhere else. The experiment works, everyone's happy, and then… nothing changes in the system. The new procedure lives in the head of the one engineer who ran the pilot. Six months later they change roles and the whole thing quietly reverts.
An experiment isn't scaled until it's encoded. That means the winning change has to translate into concrete CMMS objects:
-
The PM definition that changes (frequency, task steps, required skills).
-
The task list / job plan updated with the new procedure and acceptance steps.
-
The parts kit or BOM tied to the new task.
-
Any new failure codes or inspection readings you now want captured.
-
The trigger — time-based, meter-based, or condition-based — that actually fires the work.
Write this mapping in the original charter (field 7), before you run the experiment, in draft form. It forces you to confirm the change is even encodable. Some ideas that sound brilliant turn out to be things your CMMS can't schedule or track, and you'd rather learn that on day one than after a successful six-month pilot.
When the winning procedure gets encoded, the improvement survives turnover, gets audited like any other work, and starts generating the ongoing data that proves it's still working at scale — not just in the pilot.
Funding gates: turning a proven experiment into a budget line
A green experiment is not the same as a funded rollout. Scaling to twelve lines costs real money — sensors, training, parts, sometimes downtime to implement. Finance shouldn't have to take your word that it's worth it, and you shouldn't have to fight the same battle every time. Funding gates standardize that conversation.
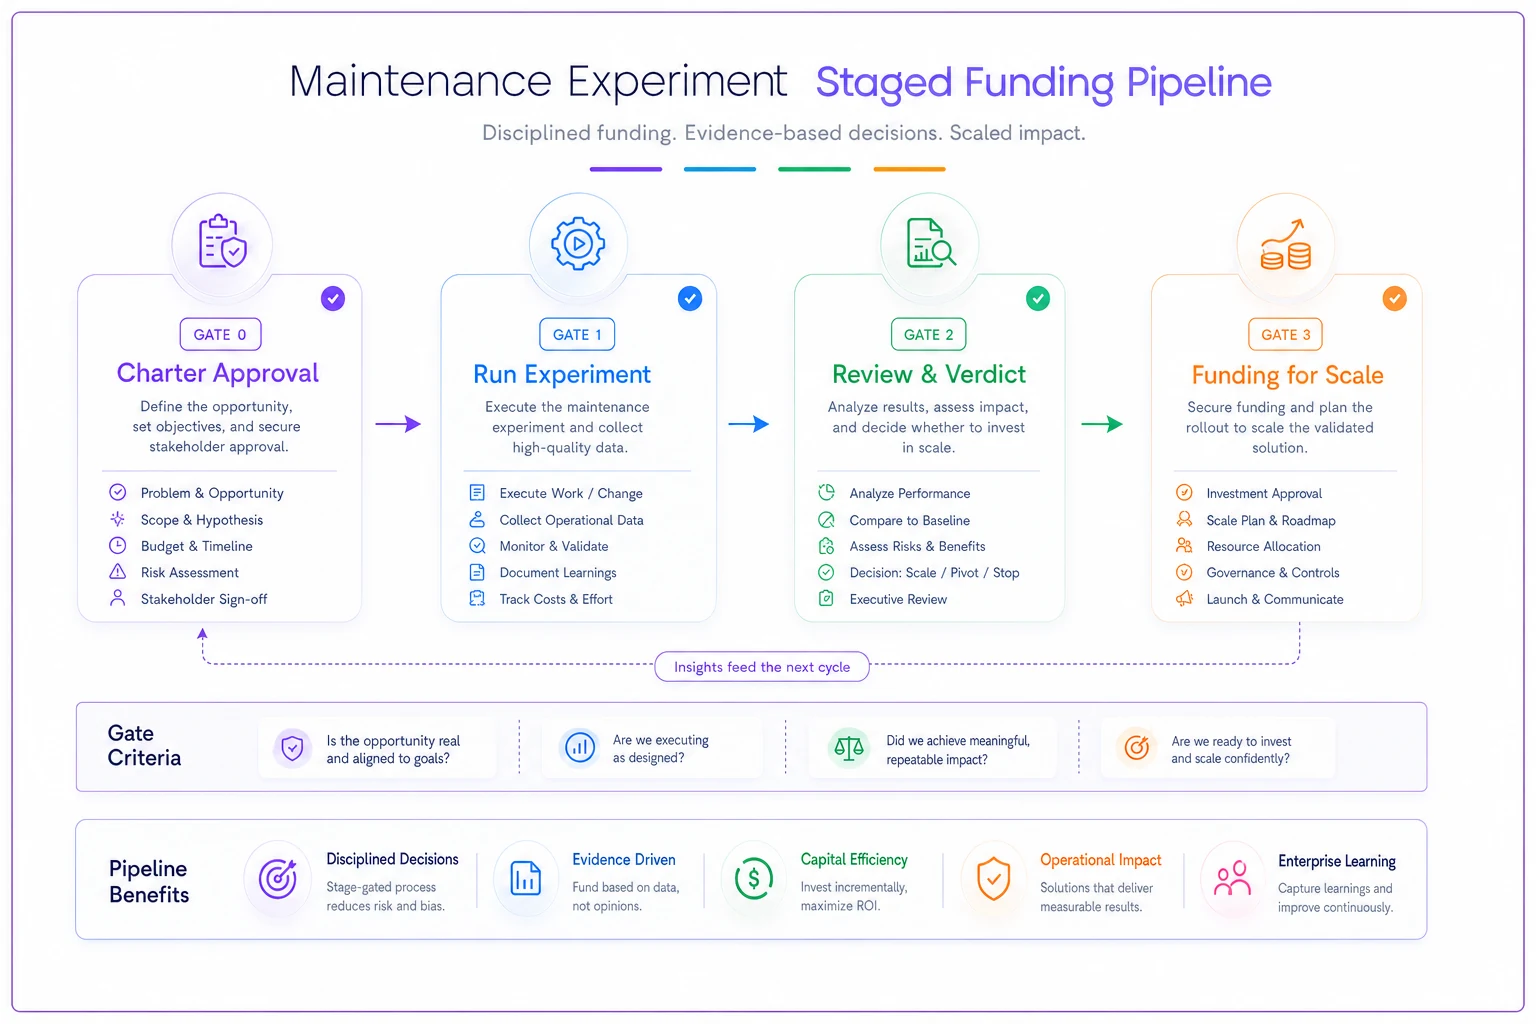
Think of it as a staged pipeline with a money decision at each boundary:
-
Gate 0 — Charter approval. Cheap. Someone with authority signs the one-pager. Confirms the experiment is worth the technician hours.
-
Gate 1 — Run. Experiment executes against its measurement plan.
-
Gate 2 — Verdict. Acceptance criteria applied. Scale / refine / kill.
-
Gate 3 — Funding for scale. For anything that passed, you present the effect size, the cost to roll out, and the projected return. This is where the experiment's cost and outcome data become the business case.
The reason this works is that by Gate 3 you're not pitching a theory — you're pitching a measured result with a known cost. That's a fundamentally easier conversation than "trust me, this'll pay off."
A simple visual of the funding-gate pipeline:
The mechanics of building that business case — lifecycle cost, depreciation, how the numbers get turned into a fundable proposal — are worth getting right, and there's a full treatment of that in the piece on turning reliability pilots into funded investments.
A real scenario: the seal-flush experiment at a mid-size plant
A food-processing plant with a maintenance team of about a dozen had a recurring problem: mechanical seal failures on their transfer pumps, running roughly 20–25 seal failures a year across the fleet, each one costing a few hours of line downtime plus parts. The reliability lead suspected the manual seal-flush procedure was inconsistent — some techs over-flushed, some skipped it under time pressure.
Instead of just rewriting the SOP and hoping, they ran it as a charted experiment. Hypothesis: standardizing the flush procedure with a fixed job plan and a photo-verified acceptance step would cut seal failures because inconsistent flushing was the causal driver. Control: matched cohort — they split the pumps into two groups matched on run hours and age, treated one group, left the other on the old procedure. Duration: six months. Primary metric: seal failures per pump. Guardrail: technician time per pump shouldn't rise more than a little.
At the review, the treated group's seal failures had dropped by roughly half, while the control group stayed flat over the same period — same season, same production. Technician time went up slightly but stayed inside the guardrail. Verdict: scale. They encoded the new job plan into the CMMS, tied it to the right parts kit, added the photo-verification step to the task list, and took the measured result to the funding gate for the sensor and training spend to cover the rest of the fleet. Because the control group made the comparison clean, nobody in the budget meeting argued about whether the effect was real.
When this cadence makes sense — and when it doesn't
There are situations where a formal experiment cadence pays for itself, and situations where it's genuinely the wrong tool.
When it's worth it:
-
You have a fleet of similar assets, so matched-cohort controls are actually possible.
-
You have enough failure history (even messy) to build a baseline.
-
You're generating more improvement ideas than you can fund, and you need a way to rank them by evidence.
-
Finance keeps rejecting reliability proposals for lack of proof — the cadence is your answer to that.
When it's a bad fit:
-
Single critical unmatched assets where you can't build any reasonable control. For those, condition-based decisions make more sense than formal experiments.
-
Safety-critical changes where you can't ethically run a control group at all — those go through engineering change control, not experiments.
-
Tiny teams with no data hygiene at all. Fix your work-order coding first, or every experiment will drown in noise.
If your backlog is on fire and technicians are purely reactive, a formal experiment cadence will feel like a luxury nobody has time for — and they'll be right. Get the backlog under control first; there's a practical approach to that in the backlog aging playbook. Stabilize, then start experimenting.
The quiet advantage: your experiments become a compounding asset
Teams that run this well end up with something more valuable than any single improvement: a growing library of charters, each with a hypothesis, a control, a clean result, and a funding decision attached. After a year you can see which kinds of interventions actually move your failure rates and which ones just sounded good. You stop relitigating the same debates because the evidence is on file. Finance starts treating your proposals differently, because your track record shows you kill your own bad ideas before asking them to pay for anything.
Good operational software helps mostly with the plumbing — keeping charters, controls, and results linked to the actual assets and work orders so the data doesn't scatter across spreadsheets and inboxes, and so the CMMS change mapping in field 7 actually connects to the PMs it's supposed to change. But the discipline is the thing. The template forces honesty up front, the control keeps you from fooling yourself, and the funding gates turn proof into budget.
Run many, judge each one honestly, kill most, scale the rest with evidence strong enough that nobody has to take your word for it.
Ready to elevate your asset operations?
Join 1,500+ businesses using Ownitly to optimize asset utilization, reduce downtime, and ensure compliance.