


Most maturity assessments end the same way: a slide with a spider chart, four colored quadrants, and a number somewhere between 2.1 and 2.8. Everyone nods. Someone says "we need to get to a 3." Then nothing happens for eighteen months because nobody translated "2.4" into a purchase order, a hiring plan, or a schedule change.
That gap — between the score and the intervention — is where maintenance maturity models go to die. The model itself isn't the problem. The problem is that maturity levels describe states while budgets fund actions. A CFO doesn't approve "moving from reactive to planned." They approve a vibration route on 40 critical assets, a data cleanup sprint, and two reliability engineer hires — each with a payback story attached.
So this is a different kind of maturity model. Five levels, yes, but every level maps to specific interventions across four dimensions — process, data, people, tooling — with the KPI panels you'd actually watch and funding gates that release money only when the prior level holds. If you're an asset manager tired of maturity theater, this is the version that survives contact with a budget committee.
Why maturity models stall between the assessment and the money
The core failure isn't ignorance about where you are. Most operations leaders know roughly how mature their maintenance program is. The failure is that the four dimensions rarely move together, and models tend to treat them as if they should.
Here's what actually plays out across sites. Process improves faster than data because process changes are cheap — you write a triage rule, you enforce a work-order priority matrix. But the data underneath is still garbage: duplicate assets, missing parent-child hierarchies, meter readings entered by three different people in three different formats. So you've got mature procedures running on immature records. The reports lie. Leadership loses trust. The whole maturity effort gets branded as "process for process's sake."
The reverse happens too. A company buys a condition-monitoring platform — tooling jumps to level 4 — while the people who'd actually interpret the alerts are still operating at level 2. The sensors scream, nobody knows the thresholds, and eighteen months later the platform is a very expensive dashboard nobody opens.
There's a pattern worth naming: maturity moves at the speed of your slowest dimension, but budgets get spent on the easiest one. Tooling is easy to buy. Data discipline is hard to sustain. People capability is slow to build. So money flows to software, and the model shows no movement because the real constraint never got funded.
That's the whole reason to tie levels to interventions across all four dimensions at once. You don't graduate a level until process, data, people, and tooling have all cleared the bar. No cherry-picking the cheap dimension.
The five levels, and what each one actually means operationally
Forget the generic labels for a second. Here's what each level looks like on the floor.
Stop losing track of critical assets.
Ownitly helps you monitor, maintain, and manage every asset efficiently and reliably.
- Centralized asset tracking
- Automated maintenance alerts
- Compliance monitoring & reporting
No credit card required
Level 1 — Reactive. You fix things when they break. There's a CMMS but it's a logbook, not a planning tool. Nobody trusts the asset list. PM compliance is unmeasured or fictional. Roughly 80% or more of labor hours are unplanned.
Level 2 — Planned. Work orders get scheduled. PMs exist and are mostly done. You can pull a backlog number that isn't insane. But the PMs are calendar-based and often over-serviced, data quality is inconsistent, and reliability is still mostly reactive underneath a planning veneer.
Level 3 — Proactive. You're doing condition-based work on your critical assets. Failure codes are used consistently enough to run basic analysis. RCA happens on repeat failures. Data lineage is defined for the KPIs executives see. This is the first level where you can actually trust your own reports.
Level 4 — Predictive. Sensor-driven interventions on high-value assets, tuned thresholds, spare parts strategy linked to failure modes. Reliability engineers own asset strategies, not just work orders. Costs are attributed per asset well enough to defend capital decisions.
Level 5 — Optimized. Maintenance decisions are risk- and cost-weighted at the portfolio level. Trade-offs between run-to-failure, PM, and PdM are made deliberately per asset class. The organization runs experiments and scales what works. This level is rare and honestly not the right target for most sites.
The mistake almost everyone makes is aiming for Level 5 across the whole portfolio. You don't need predictive analytics on a $400 pump you keep two spares of. Maturity should be applied per asset criticality tier, not as one blanket score. A healthy operation might run Level 4 on its top 15% of assets and deliberately hold Level 2 on the tail.
Mapping levels to interventions across all four dimensions
This is the part the spider chart never gives you. Below is the intervention map — what you actually do at each level, in each dimension.
| Level | Process | Data | People | Tooling |
|---|---|---|---|---|
| 1→2 | Standardize work-order flow; triage & priority rules; PM library build-out | Deduplicate asset master; enforce hierarchy; single meter-reading standard | Planner/scheduler role created; basic CMMS training | Mobile work-order execution; barcode/asset tagging |
| 2→3 | RCA on repeat failures; failure-code discipline; backlog aging governance | Failure-code taxonomy; KPI data-lineage checks; asset criticality tiering | Reliability engineer (shared); planner maturity; supervisor coaching | Condition-monitoring on critical assets; reporting layer |
| 3→4 | PM optimization (retire calendar PMs that add no value); spares strategy by failure mode | Sensor data integration; cost-per-asset attribution; downtime capture accuracy | Dedicated reliability team; analyst capability | Predictive platform; integrated EAM–ERP event flows |
| 4→5 | Portfolio risk-weighting; run experiments with measurement plans | Full lifecycle cost data; model feedback loops | Reliability embedded in capital planning | Optimization/scenario tooling; closed-loop analytics |
A couple of things worth being honest about when reading this table.
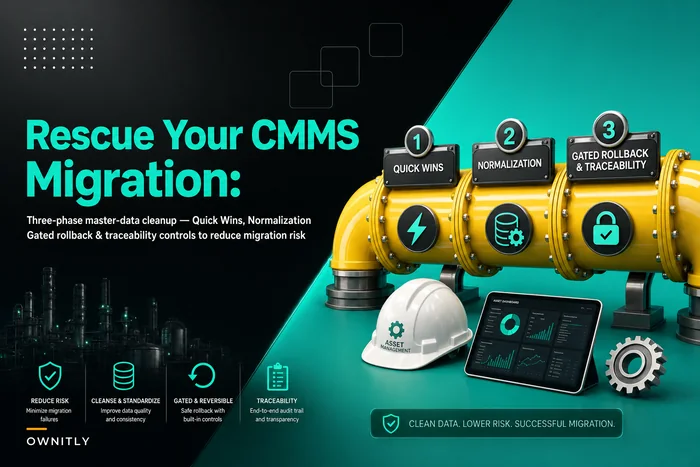
A structured, phased effort with rollback controls beats a big-bang scrub every time.
Notice how much of the early lifting is data. The 1→2 and 2→3 jumps are dominated by fixing records, not buying software. In real operations, this is where projects consistently underperform — teams treat data cleanup as a one-time task instead of an ongoing capability, so the master data quietly rots again within a year. If you're standing up or migrating a system, how you approach the cleanup matters enormously. We've put together a full three-phase master data cleanup plan with rollback controls that pairs well with the 1→3 stretch of this model.
Second: people interventions lag tooling by design in most failed rollouts. The table forces them to move together. You don't get to claim the 3→4 tooling upgrade until the analyst capability exists to use it.
The diagram below shows the workflow of mapping maturity levels to coordinated interventions across process, data, people, and tooling, and how gates release funding as panels stabilize.
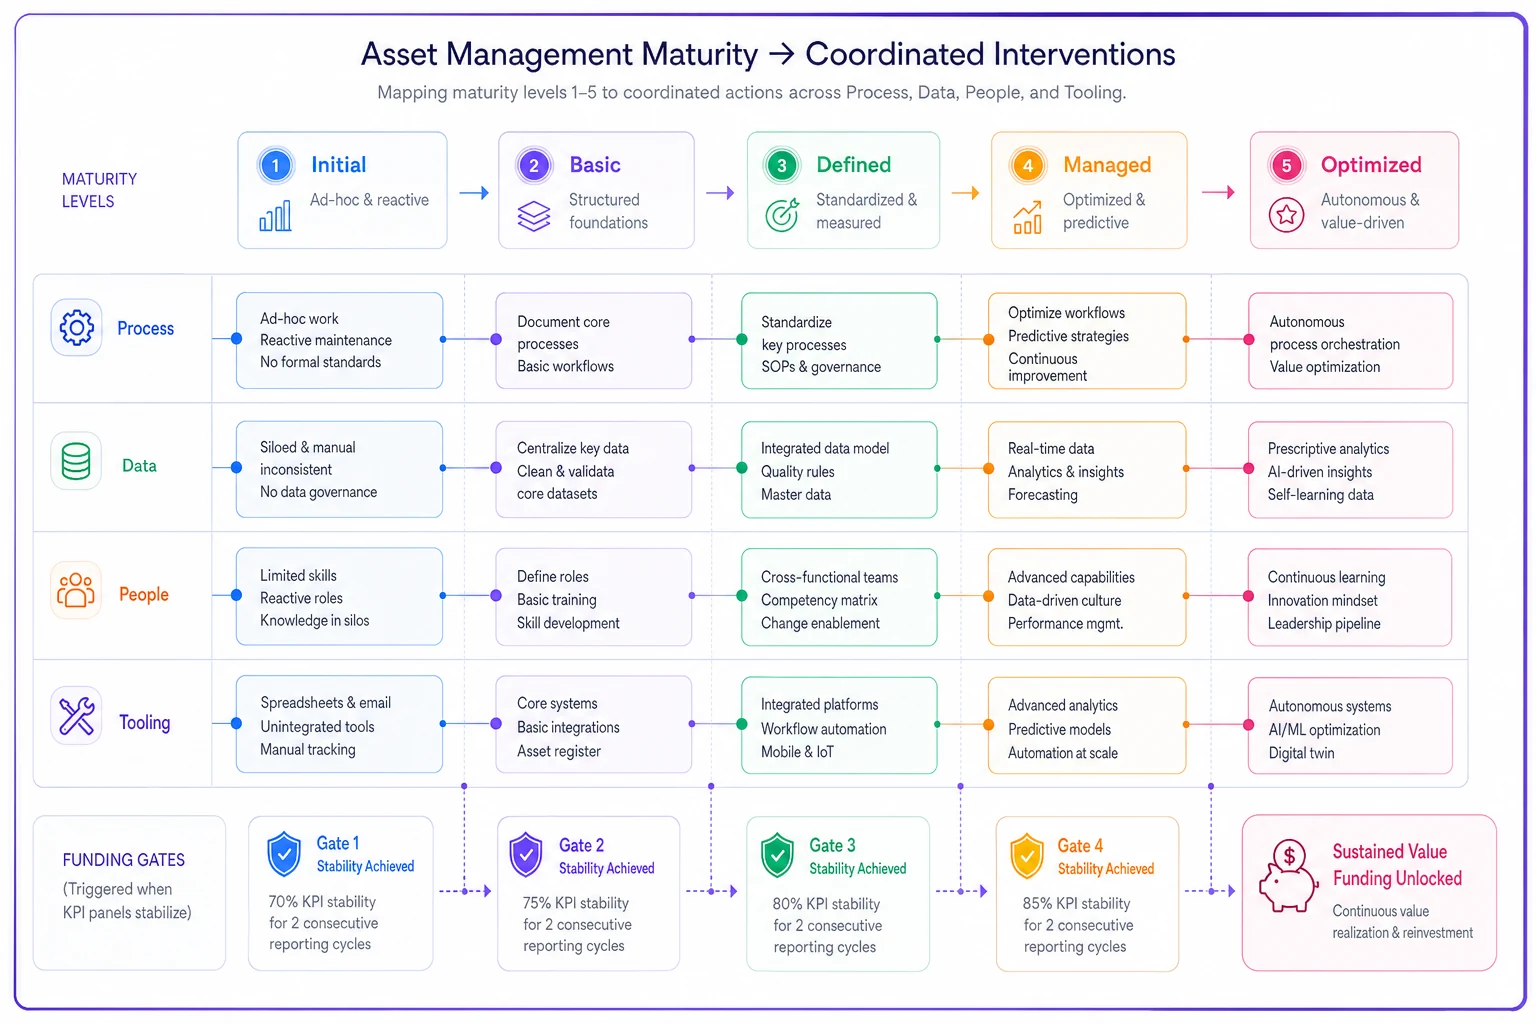
The graphic highlights that funds are released only when all four dimensions meet the exit criteria for a level.
The KPI panels you actually watch at each level
A maturity level without a measurement panel is just a wish. But the metrics that matter change as you climb — watching MTBF at Level 1 is pointless because your failure data isn't clean enough to compute it honestly.
Level 1→2 panel (are we planning at all?)
-
% planned vs unplanned labor hours
-
PM compliance (real, not scheduled-and-closed-blindly)
-
Work-order aging distribution
-
Asset master duplicate rate — a data-health leading indicator
Level 2→3 panel (is the planning real?)
-
Schedule compliance vs schedule attainment (the gap tells you if you're planning fantasy)
-
Failure-code completeness on closed work orders
-
Repeat-failure rate on top assets
-
% of critical assets with a defined criticality tier
Level 3→4 panel (are we getting ahead of failures?)
-
% of maintenance driven by condition vs calendar
-
Cost per asset (attributed, not allocated)
-
Downtime capture accuracy — do your downtime hours reconcile with production's numbers?
-
Emergency work order % (should be falling)
Level 4→5 panel (are we optimizing the portfolio?)
-
Maintenance cost as % of RAV (replacement asset value)
-
Risk-weighted backlog
-
Forecast accuracy of predictive alerts vs actual failures
-
Experiment throughput and win rate
The single most abused metric here is PM compliance. Teams hit 98% by closing PMs that were never really done, or by keeping over-serviced calendar PMs alive just because they're easy to complete. High PM compliance with flat reliability is a red flag, not a win. It usually means you're doing the wrong PMs very reliably.
Funding gates: releasing money only when the level holds
The reason maturity budgets get wasted is that funding is granted upfront for the whole journey, then spent on whatever's easiest, with no real checkpoint. Gates fix that. Each gate releases the next tranche of funding only if the prior level's panel holds for a sustained period — not a one-month spike.
-
Gate 0 — Baseline & charter. Establish the current-state panel with data you trust. Fund only the data cleanup and the assessment. No tooling purchases approved yet. Exit criteria: reliable baseline numbers and a signed intervention map.
-
Gate 1 — Planning proven. Release planning tooling and planner headcount funding once the Level 2 panel holds for roughly two consecutive quarters — planned-hours percentage up, PM compliance real, duplicate rate down. Exit criteria: no backsliding on data health.
-
Gate 2 — Proactive proven. Release condition-monitoring and reliability-engineer funding once failure-code completeness and schedule attainment hold. This is where gate reviews should get stricter, not looser — because the money now gets large.
-
Gate 3 — Predictive investment. Release predictive-platform and analyst funding. This gate should require a defensible cost-per-asset model, because you're now justifying capital on avoided downtime. Converting a pilot into sustained funding requires a real lifecycle cost case — we walk through the mechanics of turning reliability pilots into funded investments using asset lifecycle TCO models that hold up under finance scrutiny.
-
Gate 4 — Optimization. Only for portfolios where the economics genuinely justify it. Most organizations should consciously stop here or before.
The discipline that makes gates work: a spike doesn't clear a gate; a sustained level does. Anyone can hit a number for one month before a review. Requiring two quarters of stability kills the sandbagging game and forces the intervention to actually stick.
A realistic pilot design for each stage
Gates need evidence, and evidence comes from pilots scoped small enough to move fast but real enough to prove the level holds.
-
Level 2 pilot One production line or one asset class. Prove you can plan and schedule it, and that PM compliance is genuine. Duration around 8–12 weeks.
-
Level 3 pilot RCA program on the top 5–10 repeat offenders, plus failure-code discipline on that same population. You're proving the analysis capability exists, not just the intent.
-
Level 4 pilot Condition monitoring on a bounded set of critical rotating equipment, with tuned thresholds and a documented decision table for what each alert triggers. The point is to prove alerts convert to actions, not just noise.
The pilot mistake worth avoiding: scoping the pilot on your best assets and best crew, then extrapolating to the whole plant. That inflates every result. Pilot on representative assets, or run one strong and one messy site so the gate review sees the realistic spread.
A real scenario
A mid-sized food-processing operation — three plants, around 4,000 tracked assets — sat firmly at Level 1.5. They had a CMMS, but the asset master had roughly a 20% duplicate-and-junk rate, unplanned labor was somewhere north of 70%, and "PM compliance" was 95% on paper while breakdowns kept climbing.
Leadership's instinct was to buy a predictive-maintenance platform. The gate structure stopped that. At Gate 0, the only funded work was cleaning the asset master and establishing an honest baseline. That cleanup alone surfaced dozens of ghost assets still generating phantom PM labor.
Over the next two quarters they cleared Gate 1: planned labor moved from around 30% to the mid-50s, and the duplicate rate dropped under 5%. Only then did condition monitoring get funded — and it landed on roughly 60 genuinely critical assets rather than the whole plant. Emergency work orders fell by about a third within two quarters of the Level 3 push.
The predictive platform they originally wanted? It got funded eventually, at Gate 3, on maybe a quarter of the asset count they'd initially imagined — and it actually got used, because by then the analyst capability existed to do something with it. Rough avoided cost across the first year was somewhere in the mid-six figures, and most of it came from the unglamorous data and planning work, not the sensors.
When climbing further is a bad idea
Not every operation should chase Level 4, and almost none should chase Level 5 across the board.
-
Skip predictive on low-criticality, cheap-to-replace assets. If run-to-failure with spares on the shelf is cheaper than the monitoring cost, the mature choice is to stay at Level 1 on those assets — deliberately. Maturity means making that call on purpose, not achieving the highest label everywhere.
-
Don't climb if the level below isn't stable. Chasing Level 4 tooling while Level 2 data quality is quietly decaying just adds an expensive layer on a cracked foundation.
-
Small single-site operations with a handful of critical assets often top out productively at Level 3. The overhead of Level 4/5 tooling and analyst headcount doesn't pay back at that scale.
Who should absolutely not run this whole model formally? A two-person maintenance shop with 200 assets. They need clean records and good triage, not a five-gate funding program. Match the machinery of the model to the size of the operation.
Bringing it together
The value of a maturity model isn't the score — it's the sequence. Fix data before you buy analytics. Prove planning before you fund reliability engineering. Release money in tranches tied to sustained metrics, not one-month spikes. Apply the levels per asset criticality tier so you're not gold-plating pumps that don't deserve it.
Done this way, the maturity assessment stops being an annual slide and becomes a funding roadmap your finance team can actually act on. The interventions are concrete. The KPIs are watchable. The gates keep money flowing toward the constraint instead of the convenience. That's the whole difference between a maturity model that sits in a folder and one that actually moves an operation up a level and keeps it there.
The value of a maturity model isn't the score — it's the sequence. Fix data before you buy analytics. Prove planning before you fund reliability engineering. Release money in tranches tied to sustained metrics, not one-month spikes. Apply the levels per asset criticality tier so you're not gold-plating pumps that don't deserve it.
Done this way, the maturity assessment stops being an annual slide and becomes a funding roadmap your finance team can actually act on. The interventions are concrete. The KPIs are watchable. The gates keep money flowing toward the constraint instead of the convenience. That's the whole difference between a maturity model that sits in a folder and one that actually moves an operation up a level and keeps it there.
Ready to elevate your asset operations?
Join 1,500+ businesses using Ownitly to optimize asset utilization, reduce downtime, and ensure compliance.