



Most asset portfolios don't fall apart because someone made a bad call on a single pump or turbine. They fall apart because the way decisions travel through the organization is broken. Reliability engineers score assets one way, finance scores them another, the ESG team has its own spreadsheet, and by the time a request reaches the capital committee, three different versions of "priority" are competing for the same money. Nobody's lying. They're just optimizing for different things, and no one built the structure that reconciles them.
That's the real problem with asset portfolio strategy EAM at scale. Not the tooling. Not even the data quality (though that hurts). It's the absence of a decision structure that carries an asset from the field all the way to the board with its assumptions intact.
This article is about that structure — how stakeholders with genuinely different mandates get mapped into a single portfolio scoring model, how that model feeds CAPEX/OPEX pathways, and what governance artifacts you actually need so decisions survive an audit, a leadership change, and a bad year.
Why portfolio decisions fracture across stakeholders
Walk the chain of any capital-heavy operation and you'll find the same misalignment repeating.
The reliability team thinks in condition and consequence. They want to fund the assets most likely to fail and most painful when they do. Finance thinks in return, depreciation timing, and cash preservation — defer anything that isn't screaming. The ESG group thinks in emissions, water, safety exposure, and reporting obligations that increasingly carry regulatory teeth. And operations just wants the plant to run next quarter.
Each of these is a legitimate lens. The failure happens when they never converge into one scoring language. What tends to happen across capital-intensive operations is that each function builds its own ranked list, then everyone shows up to the funding meeting and argues rankings instead of debating a shared score. The loudest VP wins. The portfolio drifts toward whoever presents best, not toward what actually protects the enterprise.
A typical example: a water utility has 40 major assets flagged for intervention. Reliability ranks a raw-water intake screen at #3. Finance has it at #22 because it's fully depreciated and still running. ESG doesn't rank it at all because it doesn't touch their metrics. Then it fails during a summer demand peak, triggers a boil-water notice, and suddenly it's the only thing anyone talks about. The information to prevent that existed. It just never landed in the same column.
The decision ladder: what it actually is
A decision ladder isn't an org chart and it isn't an approval workflow. It's the sequence of translations an asset decision goes through — from raw condition data at the bottom to a governance artifact the board signs at the top — where each rung converts one stakeholder's language into the next without losing the reasoning.
Stop losing track of critical assets.
Ownitly helps you monitor, maintain, and manage every asset efficiently and reliably.
- Centralized asset tracking
- Automated maintenance alerts
- Compliance monitoring & reporting
No credit card required
Think of it as five rungs:
-
Asset signal — condition, criticality, failure history, remaining useful life.
-
Risk translation — what that signal means against the organization's stated risk appetite.
-
Portfolio scoring — a normalized score that blends reliability, financial exposure, and ESG weight.
-
Funding pathway — whether the intervention is CAPEX, OPEX, or deferred, and through which gate.
-
Governance artifact — the documented decision, its assumptions, and the trigger conditions that would reverse it.
The value isn't in any single rung. It's that each rung is explicit and traceable. When someone asks "why did we fund the compressor overhaul but defer the switchgear," the answer isn't a shrug. It's a line of reasoning you can walk from top to bottom.
The mistake most organizations make is skipping straight from rung 1 to rung 4. Someone sees a bad vibration trend and files a CAPEX request. No risk translation, no portfolio context, no governance trail. The request either gets funded on instinct or killed on budget, and either way the system learned nothing.
Mapping KPIs, risk appetite, and ESG into one score
This is where it gets uncomfortable, because you have to make weighting explicit — and executives hate being pinned to a number until they realize the alternative is being pinned to nothing.
The goal is a single portfolio score per asset that a committee can trust. Every input has to be normalized to a common scale and weighted deliberately. A workable structure looks like this:
| Input dimension | What it measures | Typical weight range | Who owns the data |
|---|---|---|---|
| Reliability / condition | Probability of failure, RUL, defect trend | 25–35% | Reliability engineering |
| Consequence of failure | Downtime cost, safety, cascading impact | 20–30% | Operations + finance |
| Financial exposure | Replacement cost, depreciation state, TCO trajectory | 15–25% | Finance |
| ESG / compliance weight | Emissions, discharge, safety exposure, reporting risk | 10–20% | ESG / compliance |
| Strategic alignment | Fit with 3-year operating plan | 5–15% | Executive / planning |
The weights aren't universal. A refinery under a consent decree will push ESG/compliance weight up. A late-stage asset base preparing for divestiture will lean financial. The point is that the weights themselves become a governance decision — reviewed annually, signed off, and version-controlled. When the weights change, the whole portfolio re-ranks, and that re-ranking is itself an audit event.
Make the weighting table a version-controlled governance artifact tied to executive sign-off so re-ranks are auditable.
A subtle trap: teams love to weight ESG at a token 5% to look compliant, then act shocked when a discharge violation costs seven figures and a headline. If your risk appetite statement says environmental exposure is intolerable, the weighting has to reflect that or the statement is theater. Tying your risk appetite to real allocation is its own discipline — we've written more on how to map maintenance risk appetite to enterprise funding allocations, and the portfolio score is where that mapping either holds or collapses.
From score to funding pathway: CAPEX, OPEX, and the gates between
A score tells you priority. It doesn't tell you how to fund it. That's the next rung, and it's where a lot of good portfolios die in translation.
Every scored intervention needs to be routed to a pathway:
-
CAPEX replacement — full asset replacement, capitalized, subject to the capital committee gate.
-
CAPEX refurbishment — major overhaul that extends useful life, often capitalizable depending on your accounting rules.
-
OPEX intervention — repair, targeted maintenance, or monitoring that stays in the operating budget.
-
Deferral with trigger — no action now, but a documented condition (a vibration threshold, a compliance deadline, a demand event) that automatically re-opens the decision.
The gates matter as much as the pathways. A gate is a checkpoint where a decision has to prove it belongs. In practice, this breaks when the gate criteria live in someone's head instead of in the artifact. A plant manager approves a $400k refurb because it "obviously needs it," and eighteen months later an auditor asks for the business case and there isn't one.
Good gates are boring and specific. For a CAPEX gate: minimum portfolio score threshold, a completed TCO comparison, a stated payback or risk-reduction target, and named accountability. For an OPEX gate: budget availability and a scoped work order. For a deferral: the exact trigger and who owns watching it.
This is the same discipline that separates a real maintenance portfolio governance model that secures enterprise funding from a wish list. The portfolio score earns the meeting; the gate earns the money.
What breaks as the portfolio scales
A decision ladder that works for one site with 200 assets behaves very differently when you're running twelve sites and 8,000 assets. The failure modes shift.
Weighting drift across sites. Each site starts nudging the weights to favor its own assets. Within two budget cycles you have twelve incompatible scoring models wearing the same name. The portfolio can't be rolled up because a "priority 1" in one region means something different in another.
Data lineage rot. At small scale, everyone knows where the condition data came from. At enterprise scale, a score is built on inputs three systems removed from the technician who logged the reading. When someone challenges a decision, no one can reconstruct the number. The whole ladder loses credibility the first time a score can't be defended.
Gate bypass under pressure. When budgets tighten or an outage looms, the gates get "temporarily" suspended. Emergency CAPEX flows around the model. Sometimes that's correct — but if it isn't captured as an exception with its own artifact, the exceptions quietly become the norm and the governance model is fiction.
Stakeholder re-fragmentation. New leadership arrives, brings its own priorities, and the carefully reconciled weighting collapses back into competing lists. The ladder only survives if the weighting decision itself is a governed, documented, hard-to-quietly-change artifact.
The pattern underneath all four: informal knowledge doesn't scale. Anything that lives in a person's judgment instead of in a documented, version-controlled decision structure will fracture the moment the organization grows past what one person can hold in their head.
A workable end-to-end workflow
Condition data and criticality flow up from the field and the CMMS into a scoring engine. The engine applies the governed weighting model and produces a normalized portfolio score for every asset. Assets above the intervention threshold get routed to a pathway classifier — CAPEX, OPEX, or deferral — based on the nature of the work and accounting rules. Each routed item generates a draft governance artifact: score, inputs, weighting version, recommended pathway, and gate criteria. The relevant committee reviews artifacts in score order, not in whoever-shouts-loudest order. Approved items convert to funded work orders or capital projects; deferred items get a trigger written back into the monitoring layer so the decision re-opens automatically when conditions change. Every approval, deferral, and exception is timestamped and retained.
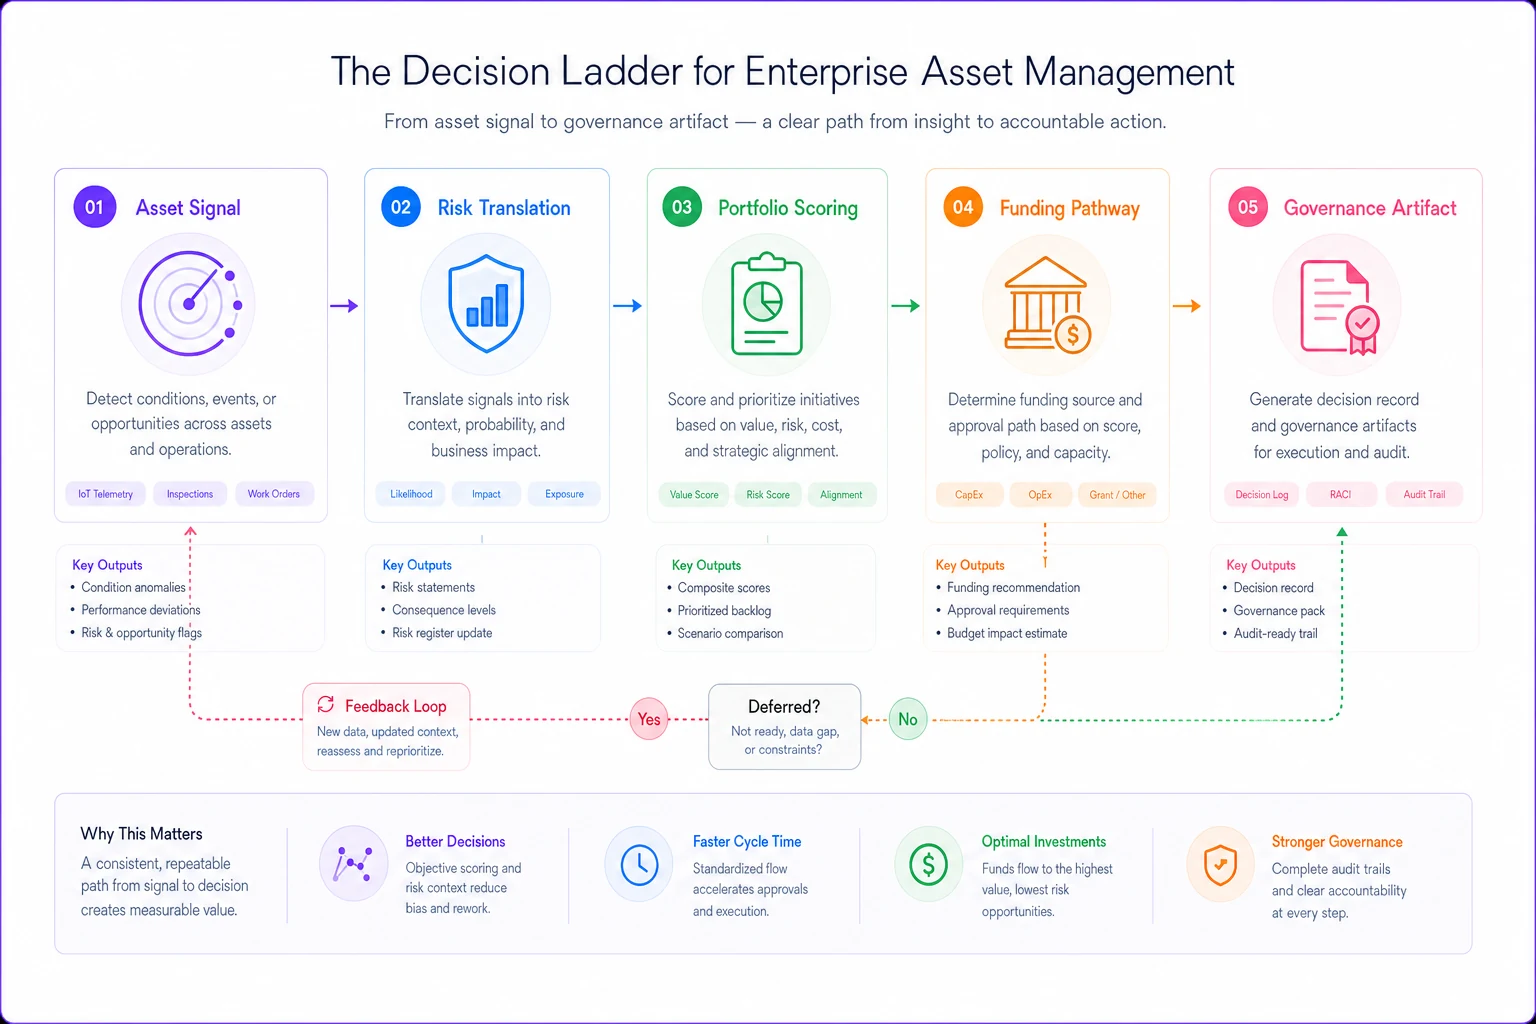
The critical property is the loop back. Deferrals aren't dead ends — they're live decisions waiting for a trigger. That's what stops the "we decided not to fund it and then forgot about it until it failed" cycle that quietly destroys portfolios.
When this level of structure makes sense — and when it doesn't
Not every operation needs a formal five-rung ladder with governed weighting. Building this out has real cost.
When it makes sense:
-
You run enough assets that no single person can rank them credibly.
-
Multiple stakeholders with different mandates (finance, ESG, reliability) genuinely compete for the same capital.
-
You face external scrutiny — regulators, auditors, boards, lenders — who will ask you to defend decisions.
-
ESG or compliance exposure is material enough that ignoring it is a real risk.
When it's overkill:
-
A single-site operation with a few dozen critical assets where one experienced engineer and one finance partner can align in a room. Formalizing that adds bureaucracy without adding truth.
-
Early-stage operations still figuring out their asset base — you'll spend more time maintaining the model than benefiting from it.
Who should not rush into this: organizations with no trustworthy condition or cost data yet. A sophisticated scoring model built on bad inputs is worse than no model, because it launders questionable data into confident-looking numbers. Fix data lineage first. A weighted score is only as defensible as the readings underneath it.
A checklist before you formalize the ladder
Run through this before you commit a scoring model to your governance process:
-
- [ ] Every scoring input has a named owner and a traceable data source.
-
- [ ] The weighting model is documented, version-controlled, and signed off at executive level.
-
- [ ] Risk appetite statements are quantified, not aspirational, and reflected in the weights.
-
- [ ] ESG/compliance weight matches actual exposure, not a token percentage.
-
- [ ] Each funding pathway has explicit gate criteria written down.
-
- [ ] Deferrals carry a specific trigger and a named owner watching it.
-
- [ ] Exceptions to gates generate their own artifact — no silent bypasses.
-
- [ ] Scores can be reconstructed from raw inputs during an audit.
-
- [ ] The committee reviews in score order, not by presenter influence.
If you can't check most of these, you don't have a portfolio strategy — you have a ranked list that changes with the room.
A real scenario
A regional food-processing company ran six plants with an aging refrigeration and utilities base. Capital requests came in as isolated business cases, each championed by a plant manager. Corporate finance funded roughly the top of the pile each year by gut feel and available cash. ESG had recently become a board-level topic because two plants had refrigerant leak exposure tied to phase-out regulations.
The problem showed up when the numbers stopped adding up. In one year they funded around $6M in capital but still had two unplanned refrigeration outages that cost somewhere in the $800k–$1.1M range in spoiled product and overtime — on assets that had been flagged but never scored above the noise, because refrigerant compliance risk lived in a separate ESG spreadsheet nobody weighted into capital decisions.
They rebuilt the process around a single scored portfolio: reliability condition, downtime consequence, financial state, and refrigerant/compliance exposure all normalized into one number with executive-signed weights. The refrigerant-exposed assets, which had been sitting mid-pack, jumped into the fundable tier once compliance exposure actually carried weight. Two deferrals got explicit triggers tied to leak-rate thresholds.
The following cycle wasn't dramatic — that's the point. Capital spend stayed roughly flat. Unplanned refrigeration outages dropped to one minor event, the refrigerant phase-out work was funded ahead of the regulatory deadline instead of scrambling into it, and for the first time the board could see why each dollar went where it did. The win wasn't a bigger budget. It was a portfolio the executives could actually defend.
Bringing it together
The organizations that get asset portfolio strategy EAM right aren't the ones with the fanciest scoring math. They're the ones who accepted that reliability, finance, and ESG will always pull in different directions — and who built a decision ladder that forces those directions into one traceable score, one funding pathway, and one governance artifact per decision.
Everything downstream depends on that. Your CAPEX plan is only as good as the score that justified it. Your ESG reporting is only as credible as the weight you actually gave it when money was on the table. And your ability to survive a leadership change or an audit comes down to whether your decisions can be reconstructed after the fact.
Build the ladder before you scale, keep the weighting honest, and make deferral a living decision instead of a quiet forget. The portfolio that results won't just perform better — it'll hold up when someone finally asks you to explain it.
Build the ladder before you scale, keep the weighting honest, and make deferral a living decision instead of a quiet forget. The portfolio that results won't just perform better — it'll hold up when someone finally asks you to explain it.
Ready to elevate your asset operations?
Join 1,500+ businesses using Ownitly to optimize asset utilization, reduce downtime, and ensure compliance.

