


Most board decks about assets fall apart the moment someone on the committee asks a follow-up question. The slide says availability is 94.2%, and a director asks "availability of what, measured how, over what window?" — and the room goes quiet. Someone promises to "circle back." That circle-back usually means three analysts spending a week reconstructing a number that should have been defined once and defended forever.
The problem isn't that asset teams lack data. They're drowning in it. The problem is that nobody has agreed on what the numbers mean, where they come from, or how they roll up from a work order on a pump to a single figure a non-technical director can act on. A board-level asset reporting KPI taxonomy is the scaffolding that holds all of that together — and when it's missing, every reporting cycle becomes an argument instead of a decision.
This article walks through how the whole reporting system works when it's built right, where it breaks as you scale across sites, and the actual templates and checks that make executive reporting trustworthy rather than performative.
Why board reporting breaks before it ever reaches the board
The failure almost never happens in the boardroom. It happens three or four layers down, in the quiet gaps between systems.
A typical breakdown looks like this: Site A calculates mean time between failures using calendar hours. Site B uses operating hours. Finance pulls asset counts from the ERP fixed-asset register, which hasn't been reconciled with the EAM in eight months. The reliability team pulls their own count from the CMMS. Three "true" numbers, three different denominators, and nobody at the top realizes the cross-site comparison they're making is meaningless.
The taxonomy problem hides until you try to aggregate. A single plant can run on tribal knowledge — everyone knows what "critical downtime" means because they've worked together for years. The second you add a second site, a new ERP module, or an acquisition, the shared assumptions evaporate. The definitions were never written down, so they can't travel.
There's a second, sneakier reason it breaks: the people building the board deck are rarely the people who own the source data. By the time a KPI reaches a slide, it's passed through maybe four hands — a technician's work-order closeout, a planner's coding, an analyst's spreadsheet, a manager's narrative. Each handoff is a chance for the meaning to drift. Nobody is lying. The number just quietly becomes something other than what the board thinks it is.
The three layers every reporting system actually has
If you want board reporting that survives scrutiny, stop thinking about "the dashboard" and start thinking about three connected layers. Most teams only manage one of them well.
Stop losing track of critical assets.
Ownitly helps you monitor, maintain, and manage every asset efficiently and reliably.
- Centralized asset tracking
- Automated maintenance alerts
- Compliance monitoring & reporting
No credit card required
Layer 1 — The taxonomy (what things mean). Definitions, formulas, denominators, inclusion/exclusion rules, and the business question each KPI answers. This is the contract.
Layer 2 — The lineage (where things come from). The traceable path from a board number back to the raw transactions — which fields, which systems, which filters. If you can't walk a number backward, you can't defend it forward.
Layer 3 — The narrative (what it means right now). The interpretation layer — why the number moved, whether it's within tolerance, what decision it implies. A number without narrative gets misread; a narrative without a number gets ignored.
Most organizations obsess over Layer 3 — the polished dashboard, the clean commentary — while Layers 1 and 2 stay informal. That's exactly backwards. The dashboard is the easiest part to fix and the least important to trust. Teams that built genuinely credible reporting usually started by locking the taxonomy, something covered in depth in the piece on building a trusted asset performance measurement system. The dashboard is just the window; the taxonomy is the foundation.
Below is a simple visual of how the three layers connect.
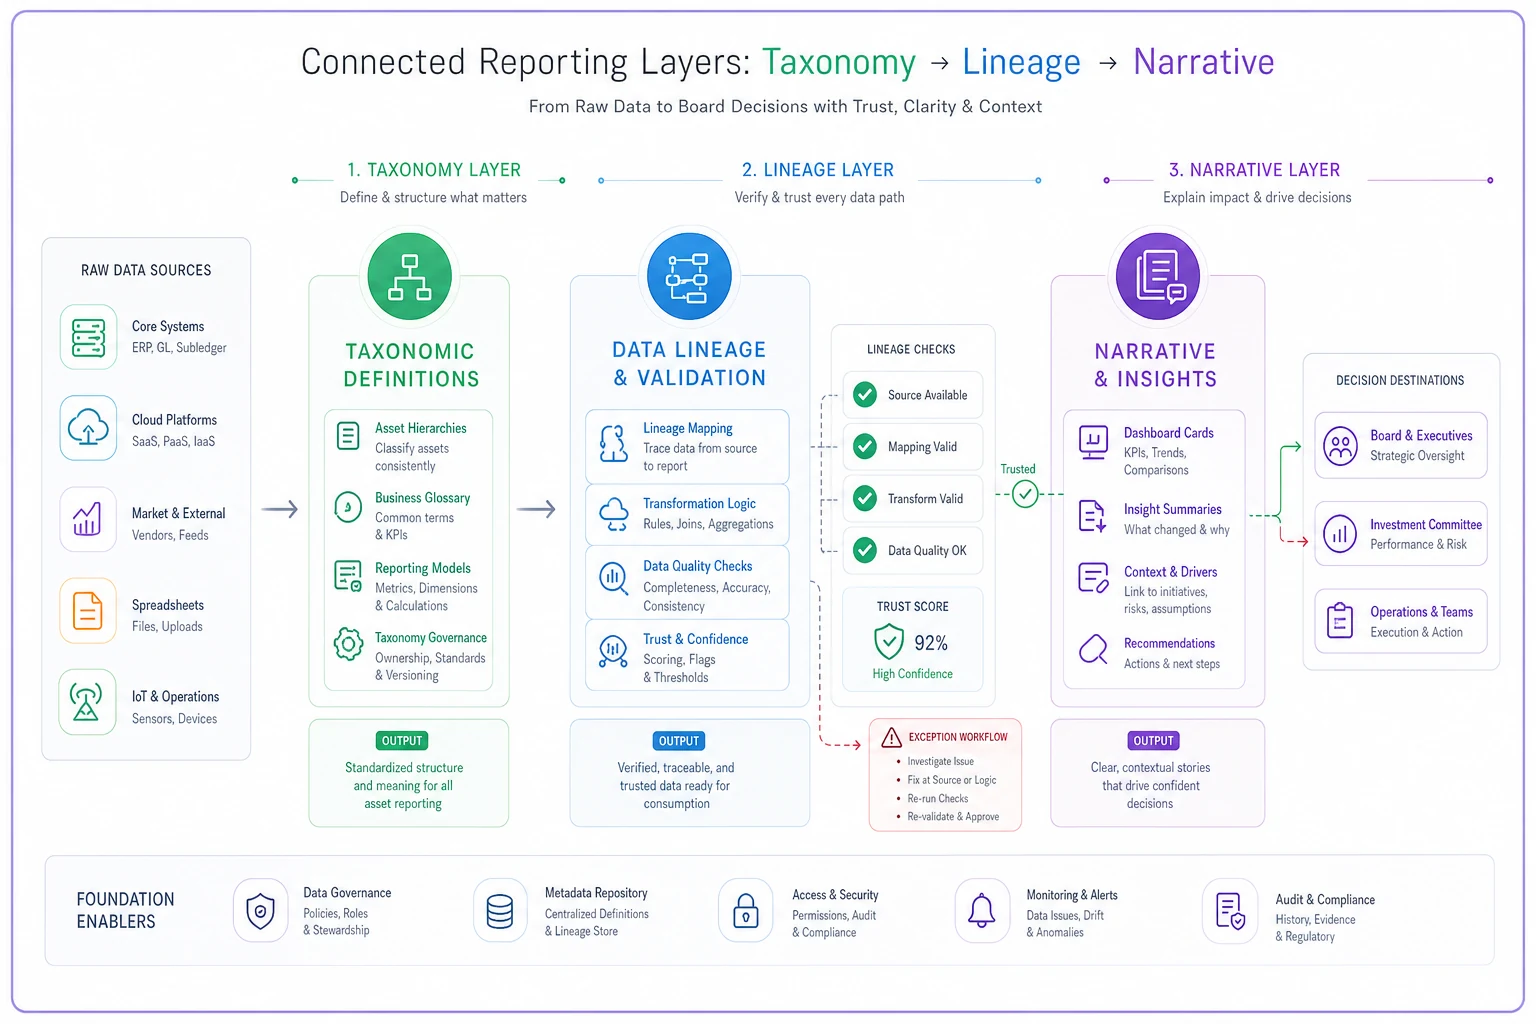
The dashboard is just the window; the taxonomy is the foundation.
Building a KPI taxonomy that a board can actually use
A board doesn't want forty metrics. They want maybe eight to twelve, organized so that each one answers a question a director would plausibly ask. The mistake most teams make is bringing the operational dashboard upstairs unchanged — the same hundred tiles the reliability engineers stare at daily. That's noise to a board.
A useful taxonomy organizes KPIs into four tiers, each answering a different kind of question:
-
Value at risk — what happens to the business if assets fail (downtime cost exposure, safety-critical asset health, deferred-maintenance liability)
-
Performance — are the assets doing their job (availability, reliability, utilization against intended use)
-
Efficiency — are we spending well to get that performance (maintenance cost per unit of output, planned vs. reactive ratio, backlog in weeks of capacity)
-
Risk and compliance — are we exposed legally or operationally (overdue statutory inspections, calibration drift, open high-risk findings)
Each KPI in the taxonomy needs a defined record, not just a name. Here's the minimum semantic definition that should sit behind every board metric:
| Field | What it locks down | Example (for "Asset Availability") |
|---|---|---|
| KPI name | The agreed label, no synonyms | Asset Availability |
| Business question | Why the board cares | Are our assets ready when operations needs them? |
| Formula | Exact calculation | Available hours ÷ scheduled operating hours |
| Denominator basis | The trap most teams fall into | Scheduled operating hours (not calendar hours) |
| Scope | Which assets count | Criticality 1 and 2 assets only |
| Inclusions/exclusions | Edge cases, pre-decided | Excludes planned shutdowns; includes weather standdowns |
| Source system | Where the raw data lives | EAM work-order + runtime meter feed |
| Refresh cadence | How current it is | Weekly roll-up, monthly board view |
| Owner | Who defends the number | Reliability lead, named individual |
The semantic definition is the part everyone wants to skip and the part that saves you in the boardroom. When a director challenges availability, the owner pulls up this record and the conversation ends in thirty seconds instead of becoming a homework assignment.
One thing worth internalizing: the denominator fights are always the worst. Availability, utilization, cost-per-asset — nine times out of ten, when two sites disagree, it's not the numerator, it's what they divided by. Lock denominators first.
Dashboard card templates with defined semantics
Once the taxonomy is set, the dashboard becomes a packaging exercise. The unit of a good executive dashboard isn't the chart — it's the card. Each card is a self-contained, self-explaining tile that ties a number to its meaning and its trust level.
A board-ready KPI card should carry five things, and this structure should be identical across every card so the eye learns it once:
-
The headline number and its unit, large and unambiguous
-
Direction and tolerance — is this inside the agreed band, and which way is good
-
Trend context — the number means little without the last few periods beside it
-
A trust indicator — a small marker showing whether the underlying data passed lineage checks this cycle
-
A one-line "so what" — the narrative hook, not a paragraph
That fourth element — the trust indicator — is what separates mature reporting from decoration. A card that silently shows a number built on 30% missing source data is actively dangerous. A card that shows the same number with a visible "data quality: degraded this period" flag is honest, and the board can weight it accordingly. Boards don't need perfect data. They need to know how much to trust what they're looking at.
A small but important pattern: color should encode tolerance, never raw value.
A small but important pattern: color should encode tolerance, never raw value. There are dashboards where a falling cost metric showed red because the template was coded to "down = bad" — and the board got anxious about something that was actually good news. Semantics have to live in the template, not in the viewer's head.
Lineage checks: how you prove the number is real
Lineage is the part that turns a nice-looking dashboard into something defensible. The question it answers is simple and brutal: can you walk any board number back to the transactions that created it, and would those transactions survive an audit?
In practice, lineage checks run at a few points in the pipeline:
-
Completeness checks — did every expected source record arrive this period? Missing runtime feeds are a classic silent killer of availability numbers.
-
Reconciliation checks — does the asset population in the EAM match the fixed-asset register in the ERP within tolerance? Persistent gaps mean you're measuring performance on a denominator finance doesn't recognize.
-
Transformation checks — did the roll-up logic actually apply the agreed formula, or did someone's spreadsheet override it?
-
Freshness checks — is the data current to the cadence the card claims?
A realistic failure mode: a site swaps a vibration monitoring vendor mid-quarter, the new feed maps to a slightly different field, and for six weeks a chunk of rotating equipment quietly drops out of the reliability roll-up. The reliability number improves because the worst assets stopped reporting. Without a completeness check, that shows up as good news on the board deck. With one, it shows up as a degraded-data flag and a note.
Lineage checks won't be perfect on day one, and they don't need to be. Start with the two or three KPIs that drive actual capital decisions and instrument those fully. Expand from there. A taxonomy with real lineage on the eight metrics that matter beats one with aspirational lineage on fifty.
Narrative templates: the part everyone improvises and shouldn't
There's a quiet pattern across asset organizations: the numbers are governed, the dashboard is governed, and then the story gets written fresh every month by whoever's preparing the deck. The result is commentary that drifts with the author's mood — optimistic in a good quarter, defensive in a bad one, inconsistent in how it frames the same kind of movement.
A narrative template fixes this by structuring commentary the same way every cycle, so the board learns to read it. A workable template for each KPI narrative:
-
What happened — the movement, in plain numbers ("planned-to-reactive ratio moved from roughly 60/40 to 68/32")
-
Why — the operational driver, not speculation ("driven by the compressor overhaul program completing on schedule")
-
Whether it matters — against tolerance and trajectory
-
What we're doing — the action, with an owner and a date
-
Confidence — how solid is this read, tied to the lineage flags
That last line is underrated. When analysts have to state their confidence, they stop overselling thin data. "Reliability improved, confidence moderate — one site's feed was partial this period" is a far more useful sentence than a clean-looking number with no caveat.
The narrative layer is also where change-management reality shows up. Rolling out consistent reporting across sites is as much an adoption problem as a technical one — people have to actually use the templates instead of reverting to their own spreadsheets. The dynamics here mirror what's laid out in the enterprise change and adoption operating model for EAM; governed reporting fails the same way any process fails, when the frontline quietly works around it.
A real scenario: multi-site utility, nine months in
A regional utility running maintenance across roughly a dozen sites had the classic symptom — every quarterly board meeting ended with action items to "reconcile the numbers." Three different availability definitions were in play. The board had largely stopped trusting the asset section of the pack and was defaulting to "spend less" because they couldn't tell good spend from bad.
The team didn't start with a new dashboard. They started with the taxonomy — locking definitions and denominators for nine board-level KPIs, naming an owner for each, and writing the semantic record for every one. Then they built lineage checks on just four of those nine: the ones tied to capital decisions. Completeness and ERP-reconciliation checks caught two feed gaps nobody had known about, including one site whose availability had been overstated for most of a quarter.
The visible change took about three reporting cycles. The board section shrank from somewhere north of twenty tiles to nine cards, each with a trust flag and a one-line narrative. The reconciliation gap between EAM and ERP asset counts, which had been sitting around 11–12%, came down into the low single digits once it was actually being watched every period. The real win wasn't a metric, though — it was that the board stopped asking for circle-backs and started asking better questions about where to put capital. That shift is the whole point.
When this level of rigor makes sense — and when it doesn't
When it makes sense: You're reporting across more than one site, you've been through or are heading into a merger, finance and operations argue about asset numbers, or the board has started discounting your reporting. Multi-site aggregation is the real trigger — the moment numbers have to travel, informal definitions stop working.
When it's overkill: A single facility with one tight team and a board that trusts them doesn't need nine semantic records and a lineage pipeline. Building heavy governance on a small, high-trust operation mostly produces paperwork. Match the rigor to the coordination problem you actually have.
Who should not start here: If your underlying master data is a mess — duplicate assets, unreconciled registers, inconsistent criticality coding — a beautiful taxonomy sits on sand. Fix the data foundations first, or you'll be running lineage checks that fail every cycle and teaching the board to distrust their own flags.
A 90-day activation checklist
If you're starting from scattered reporting, here's a sequence that front-loads the parts that build trust and defers the polish.
Days 1–30 — Lock the taxonomy
-
- [ ] Agree the eight to twelve KPIs the board actually needs, tiered by question type
-
- [ ] Write a full semantic record for each (formula, denominator, scope, source, owner)
-
- [ ] Settle every denominator fight in writing before touching a dashboard
-
- [ ] Name a single accountable owner per KPI
Days 31–60 — Build lineage and cards
-
- [ ] Instrument completeness, reconciliation, and freshness checks on the three or four capital-driving KPIs
-
- [ ] Reconcile EAM asset population against the ERP register and record the gap
-
- [ ] Build standardized dashboard cards with trust indicators baked in
-
- [ ] Encode tolerance into card color — never raw value
Days 61–90 — Activate narrative and governance
-
- [ ] Roll out the narrative template; require a confidence line on every KPI
-
- [ ] Run one full reporting cycle in parallel with the old deck to catch discrepancies
-
- [ ] Review with the board and cut any card that doesn't drive a decision
-
- [ ] Set the cadence for reviewing definitions themselves — taxonomies drift too
Days 61–90 — Activate narrative and governance
The system view
Trusted executive reporting isn't a dashboard problem, and it isn't purely a data problem. It's a coordination problem between the people who generate the data, the systems that hold it, and the people who have to decide with it. The taxonomy is the contract between them. Lineage is the proof the contract was honored. Narrative is the translation into decisions. Pull any one of those out and the whole thing quietly degrades into numbers the board nods at but doesn't believe.
The organizations that get this right treat reporting as living infrastructure, not a monthly scramble. They define things once, instrument the handoffs that matter, and let the board spend its time on capital decisions instead of reconciling denominators. That's the real return — not prettier slides, but a board that trusts the asset story enough to fund it properly.
The organizations that get this right treat reporting as living infrastructure, not a monthly scramble. They define things once, instrument the handoffs that matter, and let the board spend its time on capital decisions instead of reconciling denominators. That's the real return — not prettier slides, but a board that trusts the asset story enough to fund it properly.
Ready to elevate your asset operations?
Join 1,500+ businesses using Ownitly to optimize asset utilization, reduce downtime, and ensure compliance.