

A corporate warehouse manager once called me about $480,000 worth of motor bearings sitting in a facility that had closed eighteen months earlier. Nobody updated the inventory system. Meanwhile, the main production site had been expediting the same bearings at premium prices for over a year because their stockroom showed zero availability.
This happens constantly when companies try to pool spare parts across multiple sites without proper policies. The math looks great on paper — reduce total inventory by 30-40% while maintaining the same service levels. But operational reality destroys those projections when you don't have clear transfer rules, cost allocation methods, and decision frameworks in place.
The pooling paradox that kills most programs
Spare parts pooling sounds logical. Why keep three identical pump seals at three different sites when you could keep two total and share them? The carrying cost reduction seems obvious.
But here's what actually plays out in operations:
Site A needs a critical bearing. They check the shared inventory system, see Site B has two in stock, and submit a transfer request. Site B's maintenance planner reviews it three days later and denies it — those bearings are earmarked for their upcoming turnaround. Site A scrambles to expedite from a vendor at 3x normal cost. The bearing arrives late. Production loses eight hours.
Now Site B's planner starts hoarding parts. They inflate their criticality ratings to prevent future transfers. Site C catches on and does the same. Within six months, you're carrying more inventory than before pooling, plus you've added administrative overhead and damaged site relationships.
The fundamental problem: pooling reduces inventory costs but increases coordination complexity. Most companies underestimate that complexity by a factor of ten.
Building a transfer decision matrix that sites actually follow
A working spare parts pooling policy starts with clear transfer rules that balance local needs against network efficiency. The matrix needs to answer one question instantly: should we transfer this part or not?
Stop losing track of critical assets.
Ownitly helps you monitor, maintain, and manage every asset efficiently and reliably.
- Centralized asset tracking
- Automated maintenance alerts
- Compliance monitoring & reporting
No credit card required
Critical factors for transfer decisions:
Lead time differential matters most. If Site A can get a part from Site B in two hours but vendor delivery takes 72 hours, the transfer makes sense. But if vendor delivery is 24 hours and internal transfer takes 18 hours after approvals, you're adding risk for minimal benefit.
Stock levels at both sites drive the decision. Having four units when you need one is very different from having two when you typically burn through one a month. The policy needs specific thresholds, not judgment calls.
Criticality alignment prevents arguments. An A-critical part at the requesting site should take priority over C-critical usage at the holding site. But what about B-critical at both sites? You need tiebreaker rules written down before the situation happens.
Cost differential creates the business case. Transfer costs — transportation, handling, administration — need to be clearly less than the savings from avoiding expedited procurement or downtime.
Here's a simplified decision matrix that actually gets used:
| Requesting Site Need | Holding Site Stock | Lead Time Savings | Action |
|---|---|---|---|
| A-Critical, immediate | >2x safety stock | >48 hours | Auto-approve transfer |
| A-Critical, immediate | 1-2x safety stock | >48 hours | Manager approval required |
| B-Critical, <72 hours | >3x safety stock | >24 hours | Auto-approve transfer |
| B-Critical, <72 hours | <3x safety stock | Any | Deny, order from vendor |
| C-Critical, planned | >4x safety stock | >72 hours | Auto-approve after 24hr |
| Any criticality | <1x safety stock | Any | Auto-deny |
The key is making the matrix simple enough that a maintenance supervisor can use it at 2 AM without calling anyone.
Set safety-stock thresholds as specific unit counts to avoid judgment calls.
This flow shows the transfer decision workflow.
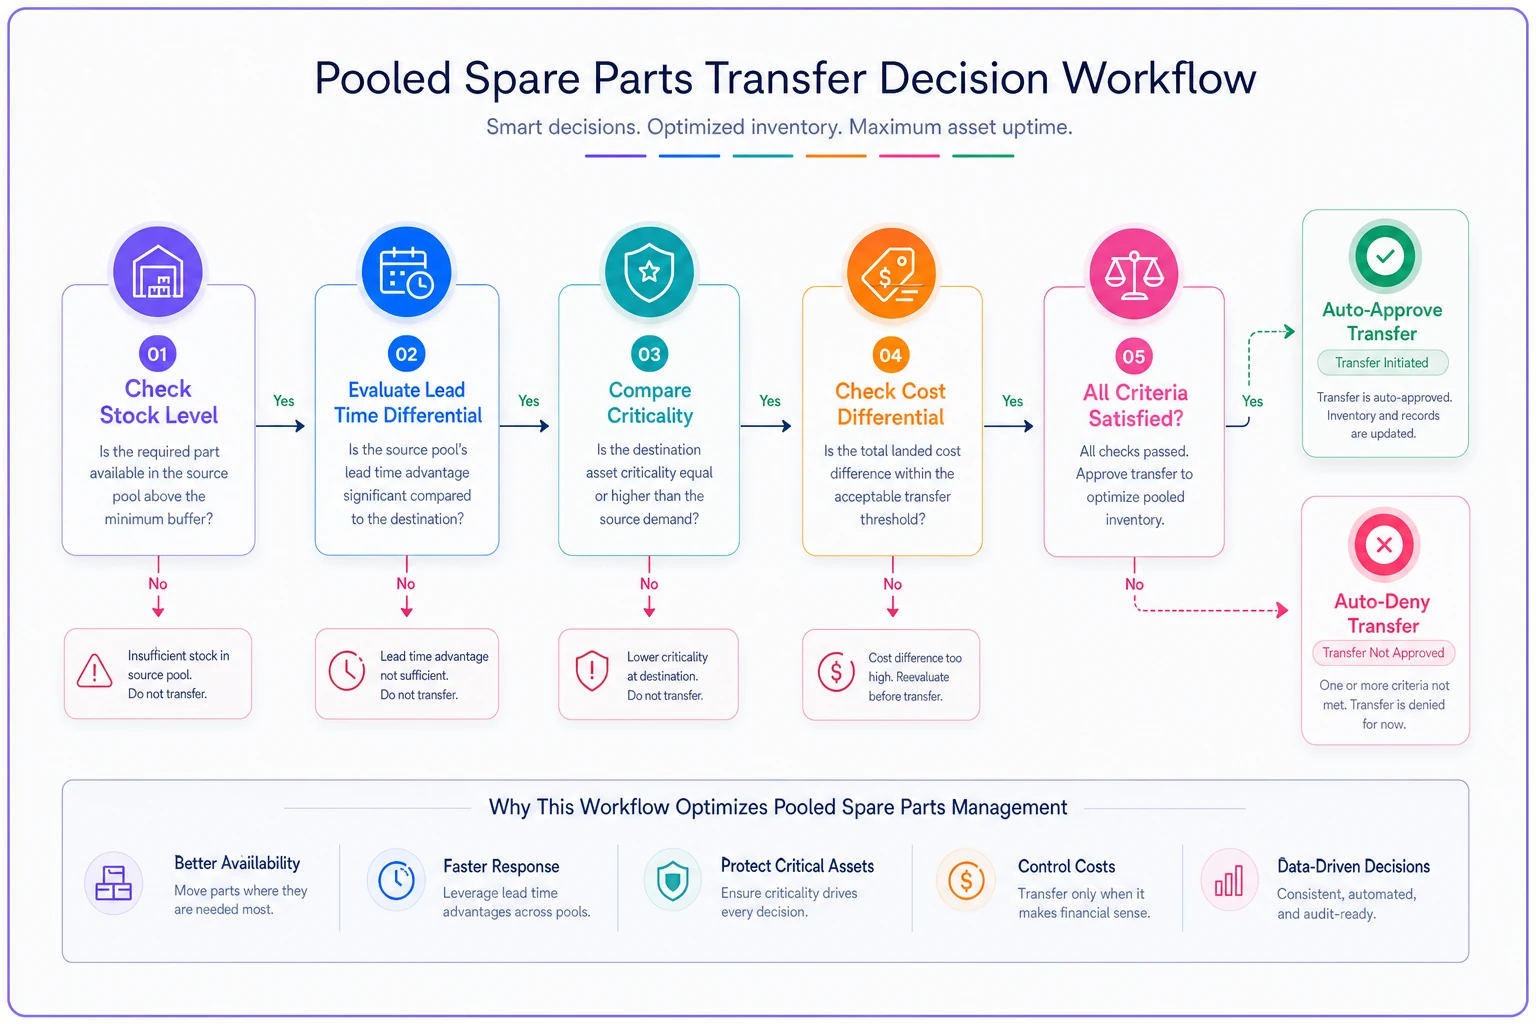
Keep this flowchart handy as a quick reference for transfer decisions.
Cost allocation methods that don't create internal warfare
The accounting treatment of pooled spares determines whether sites cooperate or compete. Most companies get this completely wrong by trying to be too precise.
Traditional approach that fails:
Site A transfers a $5,000 motor to Site B. Finance charges Site B the full $5,000 plus a 15% handling fee. Site B's maintenance budget takes a $5,750 hit. Next month, Site B refuses all transfer requests to protect their numbers. The pooling program collapses.
Allocation method that actually works:
Create a network spare parts account that sits above individual site budgets. When Site A transfers to Site B, the transaction flows like this:
-
Site A credits their inventory at average cost
-
The network account debits the same amount
-
Site B receives the part at zero cost to their budget
-
The network account amortizes the value over 12 months to all participating sites based on their percentage of total maintenance spend
This removes the disincentive to accept transfers. Sites only care about uptime, not inventory ownership.
For high-value, slow-moving parts — think above $10,000 with less than one turn per year — use a different model. The site that uses the part pays 80% of current replacement cost to the network account, regardless of which site originally purchased it. The network account uses those funds to replenish stock at the optimal location.
Monthly reporting should show:
-
Parts transferred between sites (quantity and value)
-
Cost savings from avoided expedites
-
Downtime prevented through transfers
-
Network account balance and allocation
Sites that transfer out more than they receive get a small budget credit. Sites that constantly request transfers see a small budget debit. But the impact should stay limited — typically 2-3% of maintenance budget maximum. Enough to signal behavior without creating political fights.
Numeric examples showing actual carrying cost impact
Here are real numbers from a chemical company operating four sites within 200 miles of each other.
Baseline (no pooling):
-
Total spare parts inventory
$8.2 million
-
Annual carrying cost (18%)
$1,476,000
-
Stock-out events per year
47
-
Expedite costs
$340,000
-
Downtime from parts unavailability
163 hours
Year 1 with pooling policy:
-
Total spare parts inventory
$6.1 million
-
Annual carrying cost (18%)
$1,098,000
-
Stock-out events requiring transfer
83
-
Successful transfers
71
-
Failed transfers (both sites out)
12
-
Expedite costs
$95,000
-
Transfer costs (labor + transport)
$64,000
-
Downtime from parts unavailability
51 hours
The math:
-
Inventory reduction
$2.1 million
-
Carrying cost savings
$378,000
-
Expedite savings
$245,000
-
Transfer costs
-$64,000
-
Net savings
$559,000
But the summary numbers hide a lot. Months 1-3 showed massive savings as sites cleared redundant stock. Months 4-6 saw savings decline as sites started hoarding critical spares. Month 7 required a full policy reset with clearer transfer rules and revised allocation methods. Months 8-12 delivered steady savings around $47,000 monthly.
The sites with the most disciplined inventory data cleanup practices saw roughly 40% better results than sites with messy item masters. Clean data enabled accurate availability checks and prevented phantom stock situations from derailing transfer decisions.
The three phases of pooling maturity
Companies tend to evolve through predictable phases when implementing spare parts pooling. Understanding where you are determines which policies to prioritize.
Phase 1: Opportunistic sharing (Months 1-6)
Sites still operate independently but share visibility into inventory levels. Transfers happen informally when relationships are good. Cost allocation is manual and approximate.
Focus here on building trust and proving the concept. Don't force compliance yet. Track every successful transfer and publicize the wins. When Site A helps Site B avoid a downtime event, make sure everyone hears about it.
Phase 2: Structured pooling (Months 6-18)
Formal transfer policies exist. The decision matrix is documented and trained. Cost allocation runs automatically. Sites have SLAs for transfer response times.
This phase requires real change management. Maintenance planners need new workflows. Warehouse staff need transfer procedures. Finance needs new account structures. Most programs fail here because they underestimate the operational change involved.
Phase 3: Optimized network (Months 18+)
AI-powered platforms start predicting transfer needs before stockouts occur. Inventory positioning optimization runs weekly. Sites no longer own inventory — the network does. Transfer decisions are largely automated based on criticality and uptime impact.
Few companies reach Phase 3. It requires significant technology investment and a genuine cultural shift. But those that get there typically see 45-55% inventory reduction with improved uptime.
When pooling makes sense (and when it's a terrible idea)
Pooling works when:
-
Sites are within a four-hour transport window. Beyond that, transfer lead times usually can't beat expedited vendor delivery for most parts.
-
You have fewer than ten sites in the pool. Coordination complexity grows fast. Pools with fifteen or more sites often generate more overhead cost than inventory savings.
-
The parts are expensive (above $1,000) and slow-moving (fewer than four turns yearly). Cheap, fast-moving parts aren't worth the coordination effort.
-
Sites run similar equipment. Pooling identical pump seals across identical pumps is straightforward. Pooling "similar" parts across different equipment models creates quality and compatibility problems.
-
You have strong operational discipline. Pooling requires accurate inventory data, consistent criticality ratings, and reliable transfer processes. Sites with poor maintenance documentation practices will struggle to make it work.
Avoid pooling when:
-
Union agreements restrict inventory movement between sites. Some contracts require local ownership of all maintenance materials.
-
Sites compete for production bonuses. They'll hoard inventory to protect their metrics, regardless of policy.
-
Your ERP or CMMS can't handle multi-site visibility. Manual tracking of pooled inventory breaks down within months.
-
Sites have different criticality standards. When Site A calls everything critical and Site B has rigorous ABC analysis, transfer decisions become political fights every time.
Sites have different criticality standards. When Site A calls everything critical and Site B has rigorous ABC analysis, transfer decisions become political fights every time.
Software automation for pooling workflows
Manual pooling coordination burns through administrative hours fast. A maintenance planner spending two hours daily managing transfer requests represents roughly $35,000 yearly in lost productive time. Multiply that across multiple sites and pooling overhead starts eating your savings before you even notice.
This is where AI-powered operational software changes the economics. Modern platforms automate the entire transfer workflow — identifying sharing opportunities, executing transfers, handling cost allocations — without requiring someone to babysit the process.
The platform monitors inventory levels across sites continuously, predicts upcoming needs based on maintenance schedules, and flags optimal transfers before stockouts occur. When Site A schedules a pump rebuild, the system already knows Site B has excess seals and can initiate the transfer request automatically.
More importantly, these platforms enforce pooling policies consistently. The decision matrix runs automatically on every request. Approvals route based on predetermined rules. Cost allocations calculate without manual input. Sites can't easily game the system because the software tracks patterns and flags unusual behavior over time.
The implementations that work best reduce pooling administration by 70-80% while improving transfer success rates from around 60% to well above 85%. In most cases, the software pays for itself through administrative savings alone, before you count the inventory reduction benefits.
Building your pooling implementation roadmap
Start small with a pilot between two sites that already have a decent working relationship. Pick 10-20 high-value, slow-moving parts that both sites carry. Define simple transfer rules. Track everything manually for three months.
Document every friction point. Why did transfers fail? What took too long? Which policies confused people? Where did costs surprise anyone?
Then expand gradually. Add one site at a time. Increase the parts catalog by 20-30 parts monthly. Refine policies based on actual operations, not theoretical models.
Invest in technology once you've proven the concept works. Manual pooling is fine for pilots but falls apart at scale. Budget for software automation before you exceed 50 pooled parts or three sites.
Measure the right metrics throughout:
-
Total network inventory value (should decline)
-
Transfer success rate (should exceed 75%)
-
Administrative hours per transfer (should be under 30 minutes)
-
Downtime events from parts unavailability (should decline)
-
Inter-site relationship scores (should remain stable or improve)
If any metric moves the wrong direction for two consecutive months, stop expanding and fix the root cause before moving forward.
The bottom line on spare parts pooling
Pooling spare parts across sites can deliver real carrying cost reductions — typically somewhere in the 25-35% inventory reduction range with maintained or improved uptime. But it requires more than just giving everyone visibility into each other's stock levels.
Success depends on clear transfer policies that sites actually follow, cost allocation methods that encourage cooperation rather than hoarding, and enough operational discipline to keep accurate data across locations. The companies that get all three right save millions annually. Those that rush into pooling without proper policies waste money and damage relationships between sites.
Start with a simple pilot. Build trust between sites. Refine your policies based on actual transfers, not theoretical models. Then scale gradually with technology support to handle the coordination complexity that pooling inevitably creates.
The math works. The operations are harder than they look. But with the right approach, pooling becomes a competitive advantage that permanently reduces working capital requirements while improving equipment reliability.
Start with a simple pilot. Build trust between sites. Refine your policies based on actual transfers, not theoretical models. Then scale gradually with technology support to handle the coordination complexity that pooling inevitably creates.
The math works. The operations are harder than they look. But with the right approach, pooling becomes a competitive advantage that permanently reduces working capital requirements while improving equipment reliability.
Ready to elevate your asset operations?
Join 1,500+ businesses using Ownitly to optimize asset utilization, reduce downtime, and ensure compliance.