

Most asset managers calibrate instruments on fixed schedules. Every pressure transmitter gets checked annually. Every flow meter gets pulled every 18 months. Every temperature probe gets verified twice a year. The problem is you're probably overcalibrating stable instruments while letting critical ones drift too far between checks.
A pharmaceutical plant I worked with was spending around $1.2M annually on calibrations, with roughly 85% of instruments passing without any adjustment. Meanwhile, their critical reactor temperature probes—the ones tied to batch failures worth $400k each—were drifting outside tolerance between scheduled checks. They needed a smarter approach. Risk-based calibration scheduling adjusts intervals based on what actually matters: failure impact, drift history, and process criticality. Instead of blanket schedules, you create dynamic intervals that stretch for stable instruments and tighten for problem ones.
Why fixed calibration intervals fail in complex operations
Fixed intervals made sense when we had paper records and clipboards. Set everything to annual checks, print the schedule, done. But modern operations generate a lot of calibration data that fixed schedules completely ignore.
Take a typical refinery with 8,000 instruments. Using manufacturer-recommended intervals, they might perform around 4,000 calibrations yearly. When you dig into the data though, patterns emerge fast:
-
Level transmitters in clean service stay stable for 3+ years
-
Differential pressure cells in dirty service drift within 6 months
-
Critical safety instrumented systems need verification regardless of history
-
Environmental monitoring devices require quarterly checks by regulation
The waste compounds quickly. Field techs end up spending a significant chunk of their time calibrating instruments that don't need it. Meanwhile, instruments that actually need attention slip through because the schedule says they're not due yet.
A power generation facility tracked calibration outcomes over two years. Out of 1,847 routine calibrations:
-
1,423 passed without adjustment (77%)
-
312 required minor tweaks within spec (17%)
-
112 failed and needed significant adjustment (6%)
Those 112 failures clustered around specific instrument types, specific process conditions, and specific manufacturers. The facility was running blind to these patterns while burning resources on stable equipment.
Building interval rules that balance risk and resources
Risk-based calibration starts with three core assessments for each instrument class:
Stop losing track of critical assets.
Ownitly helps you monitor, maintain, and manage every asset efficiently and reliably.
- Centralized asset tracking
- Automated maintenance alerts
- Compliance monitoring & reporting
No credit card required
Failure impact scoring: What happens if this instrument drifts out of spec? A cooling water flow meter might cause minor inefficiency. A reactor pressure transmitter could trigger a runaway reaction. You need clear scoring that captures both safety and economic impact.
Drift history analysis: How stable is this specific instrument over time? Not the model—this actual transmitter in this actual service. Some instruments hold calibration for years. Others drift monthly. Historical data tells you which is which.
Process sensitivity mapping: How much does your process care about measurement accuracy? A ±2% error in utility steam flow might be irrelevant. The same error in pharmaceutical ingredient dosing could scrap an entire batch.
Here's how a chemical plant structured their scoring matrix:
| Factor | Low (1-3) | Medium (4-6) | High (7-9) | Critical (10) |
|---|---|---|---|---|
| Safety Impact | No hazard | Minor injury possible | Major injury risk | Life threatening |
| Environmental | Contained | Minor release | Reportable release | Major incident |
| Production Loss | <$10k | $10k-$100k | $100k-$1M | >$1M |
| Regulatory | No requirement | Industry standard | Agency mandated | Legal requirement |
| Quality Impact | No effect | Rework possible | Batch rejection | Customer recall |
Each instrument gets scored across all factors. Total score determines the base interval, which then gets modified by drift history.
The drift multiplier that changes everything
Static risk scoring gives you a starting point. Drift history makes it dynamic.
Track "as found" versus "as left" values for every calibration. Calculate drift rate as percent of span per month. After three calibration cycles, you have enough data to start predicting future behavior.
A water treatment facility implemented this across their 470 instruments and found:
-
pH meters in caustic service drifted 3.2% per month
-
Ultrasonic flow meters stayed within 0.1% for 24+ months
-
Pressure transmitters showed seasonal drift patterns
They built drift multipliers from this data:
-
Drift <0.5%/month
Extend interval by 50%
-
Drift 0.5-1%/month
Keep base interval
-
Drift 1-2%/month
Reduce interval by 25%
-
Drift >2%/month
Reduce interval by 50% or investigate root cause
Within 18 months, they'd reduced total calibrations by 31% while catching 40% more out-of-tolerance conditions before they caused actual problems. Both numbers moving in the right direction at the same time—that's the point of the whole exercise.
Process conditions that break standard interval logic
Temperature swings, vibration, corrosive media, fouling—these all accelerate drift. Smart interval rules account for them.
An oil refinery mapped process conditions to interval modifiers:
Severe service (0.5x interval):
-
Temperature swings >50°F daily
-
Vibration >4mm/s
-
Corrosive media (pH <4 or >10)
-
Particulate loading >100 mg/L
-
Pressure cycling >10x daily
Moderate service (0.75x interval):
-
Temperature swings 25-50°F daily
-
Vibration 2-4mm/s
-
Mildly corrosive media
-
Light particulate loading
-
Pressure cycling 5-10x daily
Clean service (1.5x interval):
-
Stable temperature (±10°F)
-
Minimal vibration (<1mm/s)
-
Clean, non-corrosive media
-
No particulates
-
Steady-state operation
Installation factors mattered too—things that never show up in a standard fixed schedule. Instruments mounted on long impulse lines drifted faster. Transmitters exposed to direct sunlight showed seasonal patterns. Flow meters downstream of pumps needed more frequent verification. None of that shows up in a standard fixed schedule, which is exactly why so many programs miss it.
Creating scheduling templates that operations will actually follow
Your elegant risk matrix means nothing if the schedule is impossible to execute. Successful templates balance optimization with practicality.
Critical Safety Loops: Monthly verification, quarterly calibration
-
Safety instrumented functions
-
Reactor pressure/temperature
-
Emergency shutdown triggers
-
Toxic gas monitors
Regulatory Required: Fixed intervals per compliance
-
Environmental monitors (quarterly)
-
Custody transfer meters (annual)
-
FDA-regulated measurements (6 months)
Production Critical: Risk-based with 6-month minimum
-
Quality control instruments
-
Yield-determining measurements
-
Constraint bottleneck monitoring
General Purpose: Risk-based with 24-month maximum
-
Utility measurements
-
Non-critical indicators
-
Local gauges and displays
A specialty chemicals company built templates around their turnaround schedule. They grouped instruments by process unit and aligned calibrations with planned shutdowns, which eliminated roughly 60% of online calibrations and cut permit requirements significantly. They also built "calibration routes" for similar instruments in the same area—instead of sending techs out for single jobs, they'd complete 8-12 in one shift. The efficiency improvement was noticeable within the first quarter.
It sounds simple, but most sites don't do it because it requires upfront planning that nobody prioritizes until they're frustrated with the chaos of the existing approach.
Evidence packaging for auditors who don't trust your math
Risk-based scheduling sounds great until an auditor shows up. They want proof that extended intervals don't compromise safety or compliance. Smart organizations build evidence packages before anyone asks.
Your evidence package needs four components:
Statistical justification: Show the math. Drift rates, confidence intervals, probability of failure on demand. One pharmaceutical manufacturer created standard reports showing 95% confidence that instruments would remain in tolerance through extended intervals.
Risk assessment documentation: Document how you scored each instrument. Include process hazard analyses, failure mode effects, and safety integrity level assignments. Make it traceable—if you can't show your reasoning, it doesn't exist as far as an auditor is concerned.
Historical performance data: Three years of calibration history minimum. Show as-found conditions, adjustments made, and any failures caught. Highlight how risk-based scheduling improved detection of actual problems.
Management of change records: Document every interval adjustment as a formal change. Include technical justification, risk review, and approval signatures. This proves you're not improvising.
Keep a standardized folder structure and naming convention for evidence packages to speed auditor review.
A food processing plant faced FDA scrutiny over their extended calibration intervals. Their evidence package included statistical analysis of 5,000 historical calibrations, validated drift models for each instrument type, a failure rate comparison between fixed and risk-based scheduling, and a cost-benefit analysis showing resource reallocation to critical instruments. The auditor not only approved their program—he commended it as industry-leading practice. That outcome doesn't happen without the evidence package being organized and airtight before the visit.
Automated drift tracking without the PhD in statistics
Manual drift analysis kills programs before they start. Pulling historical data, calculating trends, updating intervals—it becomes a full-time job nobody actually wants.
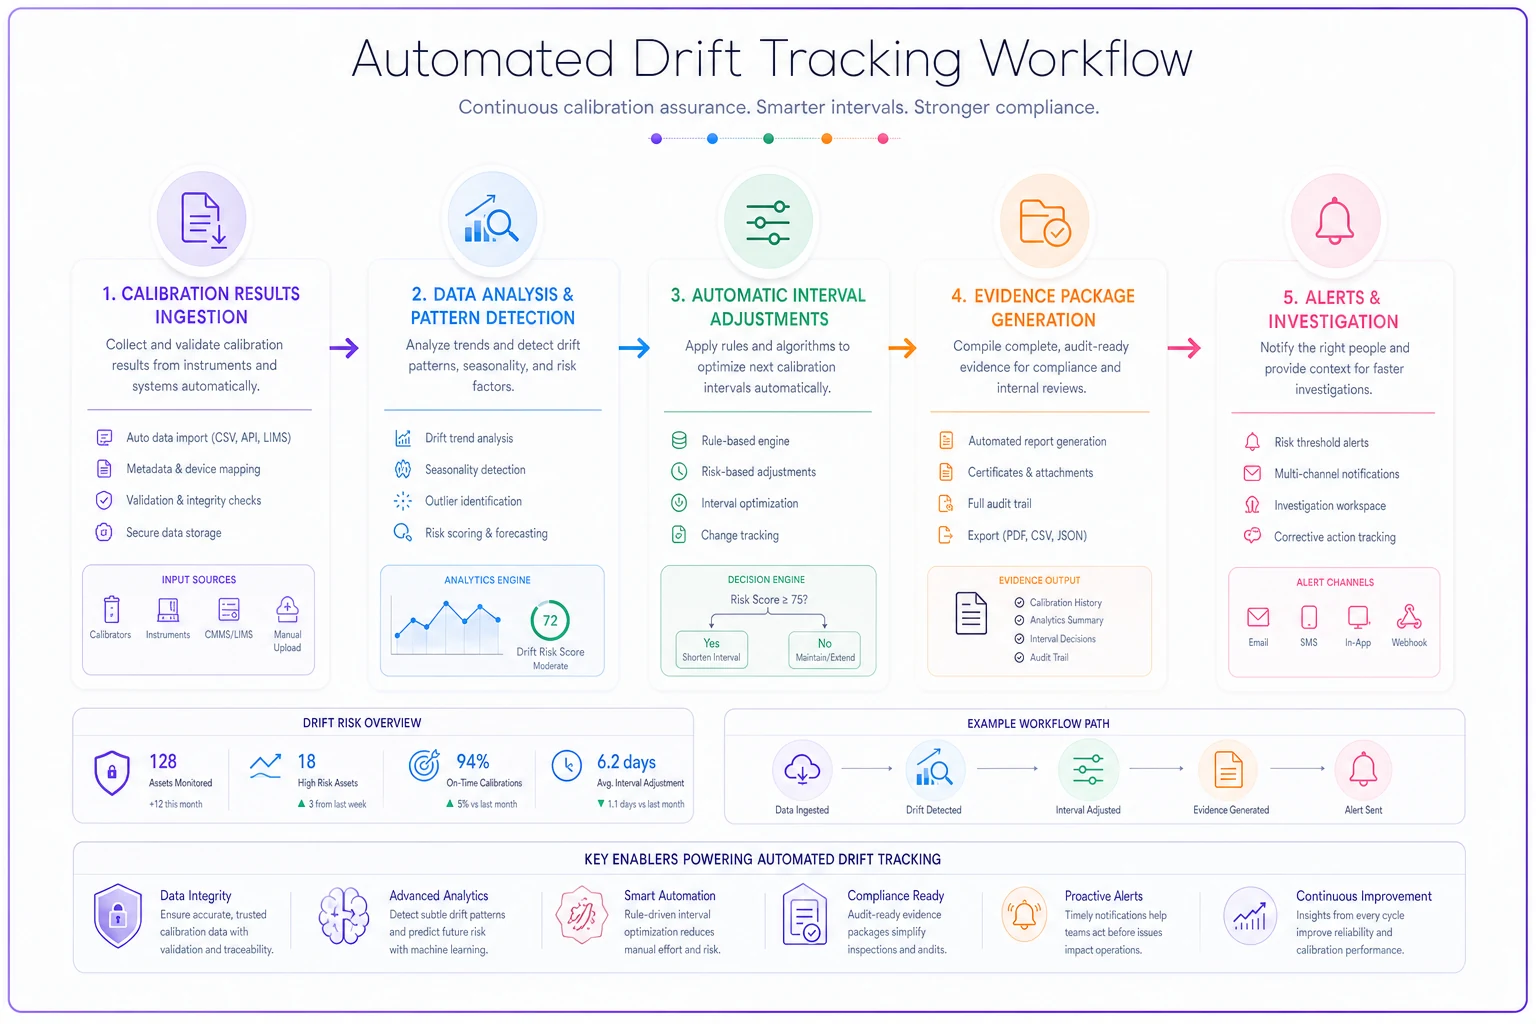
This is where operational software with AI automation becomes genuinely useful. Modern calibration management platforms can continuously analyze drift patterns across thousands of instruments. They identify outliers, predict future drift, and automatically adjust intervals based on your defined rules. Evidence packages get assembled without someone spending a week pulling reports.
Here's what automated drift tracking looks like in practice:
-
The system ingests every calibration result as it's recorded
-
Algorithms detect patterns humans miss—seasonal variations, batch-to-batch correlations, early failure indicators
-
When drift accelerates, intervals tighten automatically against your defined rules
-
When instruments prove stable, intervals extend up to your configured maximum limits
-
Evidence packages are generated on demand without manual report compilation
A petrochemical complex ran this across 6,000 instruments. The platform flagged 423 instruments with accelerating drift rates, identified 1,844 stable enough for interval extension, and surfaced 67 with suspicious patterns that warranted investigation. They prevented four potential incidents in the first year by catching drift acceleration early and reduced calibration labor by over 2,000 hours annually—time they redirected to predictive maintenance work.
Here's a simple workflow diagram:
The math on that alone justifies the software investment, but the incident prevention piece is where it really pays.
The hidden economics of overcalibration
People focus on labor savings, but overcalibration costs hit in more places than that.
Production interruption: Online calibrations require isolation, bypassing, and often partial shutdown. A paper mill calculated around $8,400 in lost production per unnecessary calibration of critical control loops.
Instrument damage: Every calibration risks damage. Overtightening fittings, contaminating sensors, disturbing installations—techs occasionally break what they're trying to verify. One facility tracked a 0.3% damage rate, adding up to roughly $45k annually in replacements.
Cascade effects: Pulling instruments triggers permit requirements, scaffold construction, confined space entry, isolation planning. A simple pressure transmitter calibration can consume 12 person-hours when you factor in all the support work.
Documentation burden: Every calibration generates paperwork. Certificates, reports, database entries, filing. A utility company calculated they were spending about 1.5 hours documenting for every hour of actual calibration work.
When you add everything up, unnecessary calibrations can run $500–2,000 each. Multiply that by hundreds of overcalibrations per year and you're burning real money on instruments that didn't need touching.
Making the transition without losing control
Moving from fixed to risk-based intervals feels risky—ironically. A phased approach keeps control while you build confidence:
Phase 1 (Months 1-6): Data Collection
-
Continue existing schedules
-
Document all as-found conditions meticulously
-
Build historical database
-
Identify obvious problem instruments
Phase 2 (Months 7-12): Pilot Program
-
Select 50-100 non-critical instruments
-
Apply risk scoring and drift analysis
-
Adjust intervals by ±25% maximum
-
Track results carefully
Phase 3 (Months 13-18): Controlled Expansion
-
Expand to 500-1,000 instruments
-
Include some critical instruments
-
Allow ±50% interval adjustments
-
Build evidence packages
Phase 4 (Months 19-24): Full Implementation
-
Roll out to all applicable instruments
-
Enable full interval range
-
Automate drift tracking
-
Optimize scheduling templates
A mining operation followed this sequence with 2,400 instruments. By month 24, they'd achieved a 34% reduction in total calibrations, a 52% improvement in catching drift before failure, around $840k in annual cost savings, and zero compliance violations. That last number matters—it's easy to cut calibration volume and create compliance problems. They didn't.
When risk-based calibration makes sense (and when it doesn't)
This approach works well for mature operations with stable processes and decent historical data. It struggles in certain situations.
Good fits:
-
Continuous process operations
-
Mature facilities with 3+ years of data
-
Operations with diverse instrument types
-
Companies facing calibration resource constraints
Proceed with caution:
-
Startup facilities with no history
-
Highly regulated industries with rigid requirements
-
Operations with frequent process changes
-
Facilities with poor calibration records
Avoid completely:
-
Legal consent decree situations
-
Recent major incidents under active investigation
-
Instruments with manufacturer warranty requirements
-
Custody transfer without regulatory approval
Being honest about where this works and where it doesn't is part of building a defensible program. Trying to force it everywhere creates more problems than it solves.
The compliance conversation that changes minds
Convincing regulators means speaking their language. Don't pitch "efficiency" or "cost savings." Focus on risk reduction and reliability improvement.
Frame it as: "We're reallocating calibration resources from stable, low-risk instruments to critical instruments showing drift patterns. This improves our ability to prevent incidents."
Give specific examples: "Our annual calibration of cooling water flow meters has found zero out-of-tolerance conditions in three years, while spot checks show our reactor temperature instruments drifting between quarterly calibrations. Risk-based scheduling lets us address the actual problem."
Show industry precedent too. FDA, EPA, and OSHA have all published guidance supporting risk-based approaches when properly justified. Reference those documents and quote their language directly—regulators respond well to seeing their own words reflected back.
A specialty chemical manufacturer won over skeptical state regulators by demonstrating improved critical instrument reliability (from 94% to 99.2%), faster detection of calibration drift (average 47 days earlier), better resource allocation with roughly twice the attention on critical instruments, and a maintained or improved overall compliance rate. The data made the argument, not the pitch.
Building your risk-based calibration program
Risk-based calibration scheduling isn't about doing less—it's about doing what matters. Combining failure impact assessment, drift history analysis, and process sensitivity into smart interval rules can dramatically improve reliability while cutting waste.
Start with obvious wins. Utility instruments that never drift? Extend their intervals. Problem instruments that constantly fail? Tighten their schedules. Build evidence, track results, and expand gradually.
The facilities seeing the best outcomes combine structured methodology with software that handles drift analysis and evidence packaging automatically. They're catching problems earlier, spending less on unnecessary work, and ending up with compliance programs that auditors actually respect rather than just tolerate.
Stop calibrating on autopilot. Your instruments tell you what they need through their drift patterns—you just need a system that listens and responds accordingly.
Stop calibrating on autopilot. Your instruments tell you what they need through their drift patterns—you just need a system that listens and responds accordingly.
Ready to elevate your asset operations?
Join 1,500+ businesses using Ownitly to optimize asset utilization, reduce downtime, and ensure compliance.