



The third pump failure in six weeks usually triggers the same response: another emergency repair, another band-aid fix, more finger-crossing. But when you're managing millions of dollars worth of rotating equipment across multiple plants, you can't keep reacting to the same failures over and over.
A structured RCA sprint changes that. Instead of letting root cause analysis drag on for weeks while failures keep stacking up, you compress the whole investigation into 72 hours—field data to CMMS corrective tasks, with clear decision points along the way.
The key isn't just speed. It's having the right forms, artifacts, and conversion processes ready before you start. When a centrifugal pump at a polymer plant failed three times in two months, the maintenance team used this exact sprint framework to identify bearing misalignment within 72 hours and implement corrections that prevented an estimated $340,000 in projected downtime.
The Hour-by-Hour Sprint Schedule
The sprint starts the moment a repeat failure crosses your threshold. For most operations, that's two similar failures within 30 days or three within a quarter on the same asset class.
Hour 0–4: Initial Response Team Assembly Pull together your core team immediately. You need a field technician who knows the equipment, an operations rep who understands process conditions, and someone from reliability engineering. Keep it to 4–5 people max. Larger teams slow everything down.
Hour 4–12: Field Data Collection This is where most RCA efforts fall apart. Teams either drown in irrelevant data or miss critical evidence because nobody had structured forms ready. Your field inspection forms need specific sections covering operating conditions at failure (pressures, temperatures, flow rates), physical damage patterns with photo requirements, lubricant condition and samples, vibration readings if available, and recent maintenance history pulled from CMMS.
Hour 12–24: Hypothesis Generation Lock your team in a room with all field data on the walls or on screens. Generate at least five failure hypotheses. Each one needs a clear failure mechanism, supporting evidence from field data, contradicting evidence if any exists, and required tests to prove or disprove it.
Hour 24–48: Testing Phase Run targeted tests to validate hypotheses. Not everything needs expensive lab work. A simple dimensional check or voltage reading can eliminate multiple theories fast. Focus testing resources on the most likely causes first.
Hour 48–60: Analysis and Decision Review test results against your original hypotheses. By now, you should have a clear winner or at least narrowed it down to two. Make the call on root cause.
Hour 60–72: CMMS Conversion Turn your findings into actionable CMMS tasks. This isn't just creating a work order—it's building a complete corrective action package.
The workflow below shows how these phases connect from trigger to corrective task:
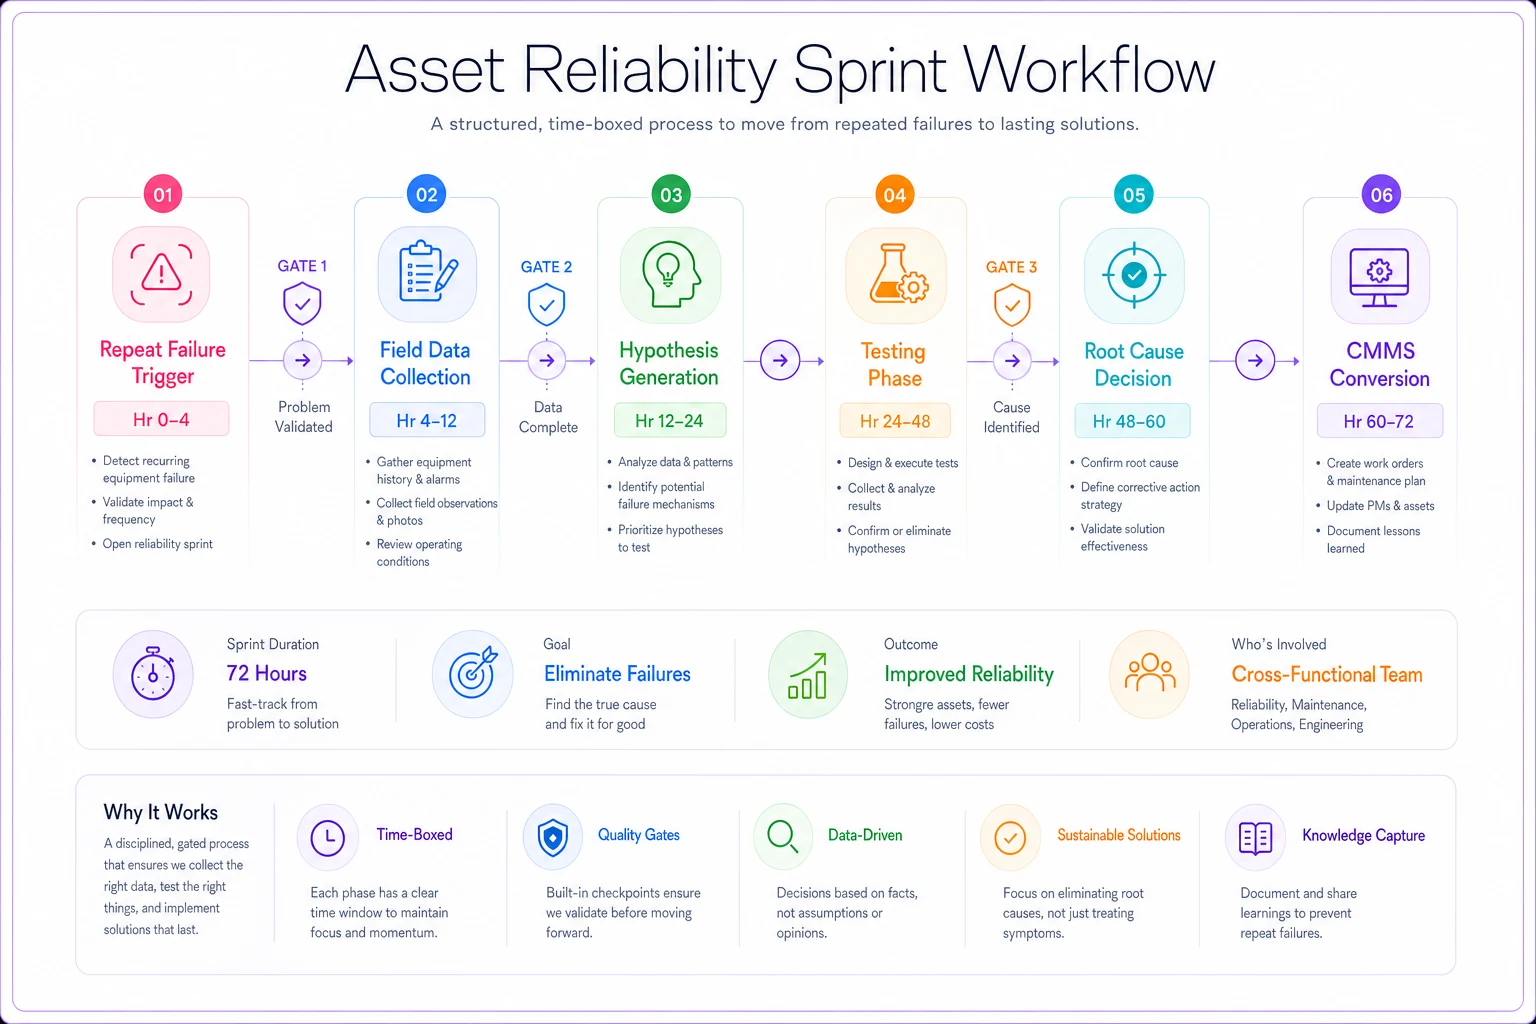
Each gate is a hard stop. If the data isn't there, you stop and regroup—not push forward on incomplete information.
Required Artifacts and Documentation
The difference between a productive sprint and a wasted 72 hours usually comes down to whether the right templates existed before anyone walked out to the equipment.
Stop losing track of critical assets.
Ownitly helps you monitor, maintain, and manage every asset efficiently and reliably.
- Centralized asset tracking
- Automated maintenance alerts
- Compliance monitoring & reporting
No credit card required
Field Inspection Form Template
Your inspection form drives data quality. Generic "describe the problem" fields produce generic results. Structure your forms around failure modes instead.
Mechanical Failure Section:
-
Wear patterns (uniform/localized/progressive)
-
Fracture characteristics (brittle/ductile/fatigue)
-
Deformation type (plastic/elastic/thermal)
-
Contamination evidence
Electrical Failure Section:
-
Insulation condition ratings
-
Contact surface inspection results
-
Temperature rise patterns
-
Grounding measurements
Process-Induced Failure Section:
-
Cavitation indicators
-
Erosion patterns
-
Corrosion types
-
Fouling/scaling evidence
Each section needs specific photo requirements—not "take pictures if needed," but actual defined shots: bearing housing from three angles, coupling alignment marks, oil sight glass clarity. Mobile forms make this much smoother since technicians can upload photos directly to tagged sections while still standing at the equipment.
Hypothesis Testing Worksheet
Most teams generate hypotheses but don't structure the testing properly. Your worksheet needs these five elements for every hypothesis entered:
-
Hypothesis statement — one sentence, testable
-
Required evidence — what would prove this true
-
Test method — specific procedure, not a vague description
-
Resource requirements — tools, time, expertise
-
Go/No-go criteria — clear pass/fail metrics
For a bearing failure hypothesis, don't write "check alignment." Write: "Measure coupling alignment using reverse dial indicator method. Parallel misalignment >0.003" or angular >0.001"/inch confirms hypothesis." Specific enough that anyone on the team can execute it the same way.
Having this format locked in before testing starts prevents the back-and-forth that kills sprint momentum around hour 36. The ordered structure above also makes it easier to hand off test execution if your lead analyst needs to step away.
Decision Gate Checklist
Three decision gates keep the sprint from drifting:
Gate 1 (Hour 12): Field data sufficient to proceed?
-
Minimum 10 photos captured
-
Operating data for 24 hours before failure
-
Physical samples collected if required
-
CMMS history reviewed for past 6 months
Gate 2 (Hour 36): Hypotheses ready for testing?
-
At least 5 hypotheses documented
-
Testing requirements defined for each
-
Resources available for critical tests
-
Testing sequence prioritized
Gate 3 (Hour 60): Root cause determination complete?
-
Primary cause identified with >80% confidence
-
Supporting evidence documented
-
Minority opinions recorded if any
-
Corrective actions defined
If you can't clear a gate, stop the sprint. Pushing through with missing data produces bad corrections that fail again in three months.
Converting RCA Results to CMMS Tasks
This is where most RCA efforts die. Teams figure out what went wrong and then nothing gets systematically fixed. The sprint only matters if findings get converted into CMMS tasks before it closes.
Immediate Corrective Tasks
Within two hours of root cause determination, create three work orders:
-
Primary correction task — fix the identified root cause
-
Verification task — confirm the fix worked, scheduled 30 days out
-
Similar asset inspection — check other equipment with the same failure risk
Each task needs specific requirements. For a lubrication-related root cause, that looks like: Primary: "Replace bearing housing seals per drawing M-4421. Verify shaft runout <0.002" before installation." Verification: "Collect oil sample per procedure OS-101. Check for moisture <200ppm and ISO cleanliness 18/16/13." Similar asset: "Inspect all Series 420 pump bearing housings for seal degradation using checklist BH-12."
Vague work orders are how good RCA findings get wasted. The technician who shows up six weeks later has no idea what level of rigor was intended.
Preventive Task Modifications
RCA findings should trigger PM updates. But don't just add more tasks—modify the ones that already exist. If bearing failures traced back to inadequate lubrication intervals, update the existing quarterly PM to include grease quantity specifications (3.2 oz, not "add grease"), temperature checks before and after, purge requirements, and visual inspection criteria.
Link modifications back to your RCA report number. Six months later, when someone questions why bearing temperatures get checked during lubrication routes, the answer is sitting right there in CMMS.
Pilot Program Setup
Not every corrective action needs immediate fleet-wide deployment. For significant changes, run a pilot first. Select 2–3 assets for initial implementation, define success metrics like MTBF improvement or vibration reduction, set an evaluation timeline of 60–90 days, and create dedicated CMMS task codes for tracking.
Track pilot tasks separately using specific job plan codes. This lets you measure impact without muddying your baseline metrics. When the pilot proves out, you have actual data to justify broader rollout rather than just engineering judgment.
Common Sprint Killers and How to Avoid Them
Analysis Paralysis at Hour 40 Teams get stuck debating hypotheses instead of testing them. If you're past hour 40 and still arguing theories, run the simplest discriminating test available. A 20-minute dimensional check beats two hours of circular conversation every time.
Missing Critical Expertise Your vibration analyst is on vacation exactly when you need bearing failure investigation. Build your sprint roster with primary and backup resources for each specialty. Sometimes bringing in an external lab for specific tests is faster than waiting for internal resources to free up.
Scope Creep The sprint starts focused on pump failures, then someone suggests looking at the entire cooling system "while we're at it." Don't. Document the additional observations for future investigation and stay on the original scope.
Over-documenting Some teams spend 20 of their 72 hours polishing reports instead of solving problems. Sprint documentation needs to be good enough for CMMS conversion—not publication-ready. Clean it up after implementation if it matters.
Measuring Sprint Success
Track these metrics across multiple sprints to refine your process over time:
| Metric Category | What to Track | Target |
|---|---|---|
| Speed | Time from failure to root cause | ≤72 hours |
| Speed | % of sprints completed on time | >80% |
| Quality | Repeat failures after correction | Drop 70%+ |
| Quality | Hypothesis accuracy rate | Improve sprint over sprint |
| Quality | Downtime reduction from corrections | Track per asset |
| Implementation | CMMS tasks created per sprint | 3+ minimum |
| Implementation | PM procedures modified | At least 1 per sprint |
A pharmaceutical manufacturer running these sprints monthly saw repeat failure rate drop from 18% to roughly 4% within six months. Average root cause investigation time went from three weeks to three days. That's not from working harder—it's from having a structured process that doesn't let investigations drag.
Tracking these numbers also makes it easier to justify sprint resources to management. After six months of data, the case is obvious.
Decision Framework for Sprint Triggers
Not every failure warrants a 72-hour sprint. Use this decision matrix:
| Failure Type | Frequency | Impact | Sprint? |
|---|---|---|---|
| Critical asset, first occurrence | Once | >$50K downtime | No — monitor |
| Critical asset, repeat | 2+ in 30 days | >$50K downtime | Yes — immediate |
| Non-critical, chronic | 3+ in 90 days | <$10K each | Yes — scheduled |
| Non-critical, random | Sporadic | <$10K | No — standard RCA |
| Safety-related | Any | Any injury risk | Yes — immediate |
Your thresholds might shift based on operation size, but the logic stays the same: combine frequency, impact, and criticality to decide whether a sprint is warranted. Most operations find they're running 2–4 sprints per month once the infrastructure is in place.
Building Your Sprint Infrastructure
Getting your first sprint infrastructure ready takes roughly 40 hours of setup work spread across three weeks.
Week 1: Template Development Create field inspection forms for your top 5 failure modes, build hypothesis testing worksheets, design decision gate checklists, and draft CMMS conversion procedures.
Week 2: Team Preparation Identify sprint team members and backups, run a tabletop exercise using a historical failure, set up communication protocols, and configure CMMS for sprint task coding.
Week 3: Pilot Sprint Run your first sprint on a current or recent failure, document gaps in the templates, refine based on team feedback, then update templates and procedures before the next one.
The setup pays back fast. After three or four sprints, most teams have recovered their setup time through faster problem resolution alone.
Integration with Existing Reliability Programs
Link to Work Order Triage:
When triage identifies repeat failures, automatically trigger sprint evaluation. Your triage matrix already classifies work by criticality—use those same thresholds for sprint decisions so nothing falls through the gap.
Feed Condition Monitoring:
Sprint findings often reveal predictive maintenance coverage gaps. A bearing failure investigation might show you need vibration monitoring on equipment that was never instrumented. Update your condition monitoring database with sprint-identified critical points.
Support Capital Planning:
When sprints repeatedly flag design issues, compile that evidence for capital project requests. Three sprints documenting pump failures from inadequate NPSH make a stronger case for system redesign than any standalone engineering study.
Managing Sprint Resources with Operational Software
The hardest part of maintaining sprint capability isn't the analysis—it's coordination. Getting the right people available within a few hours, having test equipment staged, and making sure CMMS access is configured correctly. Manual coordination across multiple sites breaks down fast.
AI-powered operational software can streamline a lot of this. When a repeat failure triggers sprint criteria, automated workflows can assemble the team, prepare digital inspection forms, and flag required test equipment—before the first technician reaches the equipment. During the sprint, AI assistance can surface similar historical failures from your database, suggest relevant test procedures, and help identify patterns that might not be obvious when you're deep in the investigation.
The CMMS conversion step becomes less painful too. Properly formatted work orders, updated PM schedules, pilot tracking codes—platforms that automate this remove a chunk of administrative work that otherwise eats into sprint time. Some facilities using AI-assisted sprint coordination have brought their average timeline down to around 48 hours while actually improving documentation quality. That time savings comes from reducing administrative friction, not from cutting corners on analysis.
Getting Started
A well-structured RCA sprint changes how you deal with repeat failures. Instead of letting problems drag while committees debate, you move from failure to correction in 72 hours—or close to it.
Start with one sprint on your most persistent repeat failure. Use the templates and timelines here, but adjust them to fit your operation. After a few iterations, you'll have a process that actually fits how your team works.
The goal in 72 hours isn't a perfect answer. It's a good-enough correction implemented fast enough to stop the bleeding, with enough documentation to improve it later. Most repeat failures have straightforward root causes hiding behind complicated-looking symptoms. A structured sprint cuts through that and gets fixes in place while the failure is still fresh in everyone's memory.
Your equipment doesn't fail on your schedule—but with a solid sprint process, you can at least respond on a timeline that limits damage and prevents the next one.
Ready to elevate your asset operations?
Join 1,500+ businesses using Ownitly to optimize asset utilization, reduce downtime, and ensure compliance.